timeline
History of timeline projects
With my retirement starting on June 10th, 2023 I started this repository to create a as graphic document to better align events in the flow of time and visualize connections between people and events. These are:
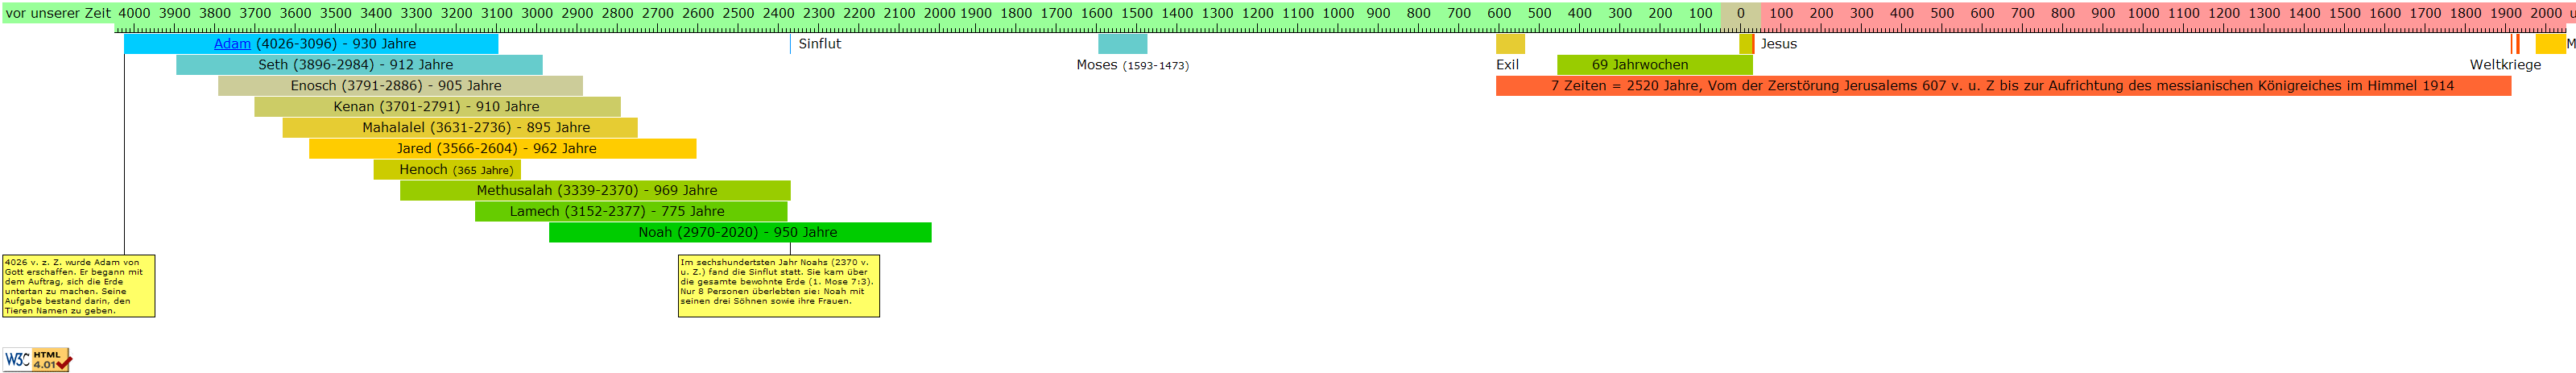
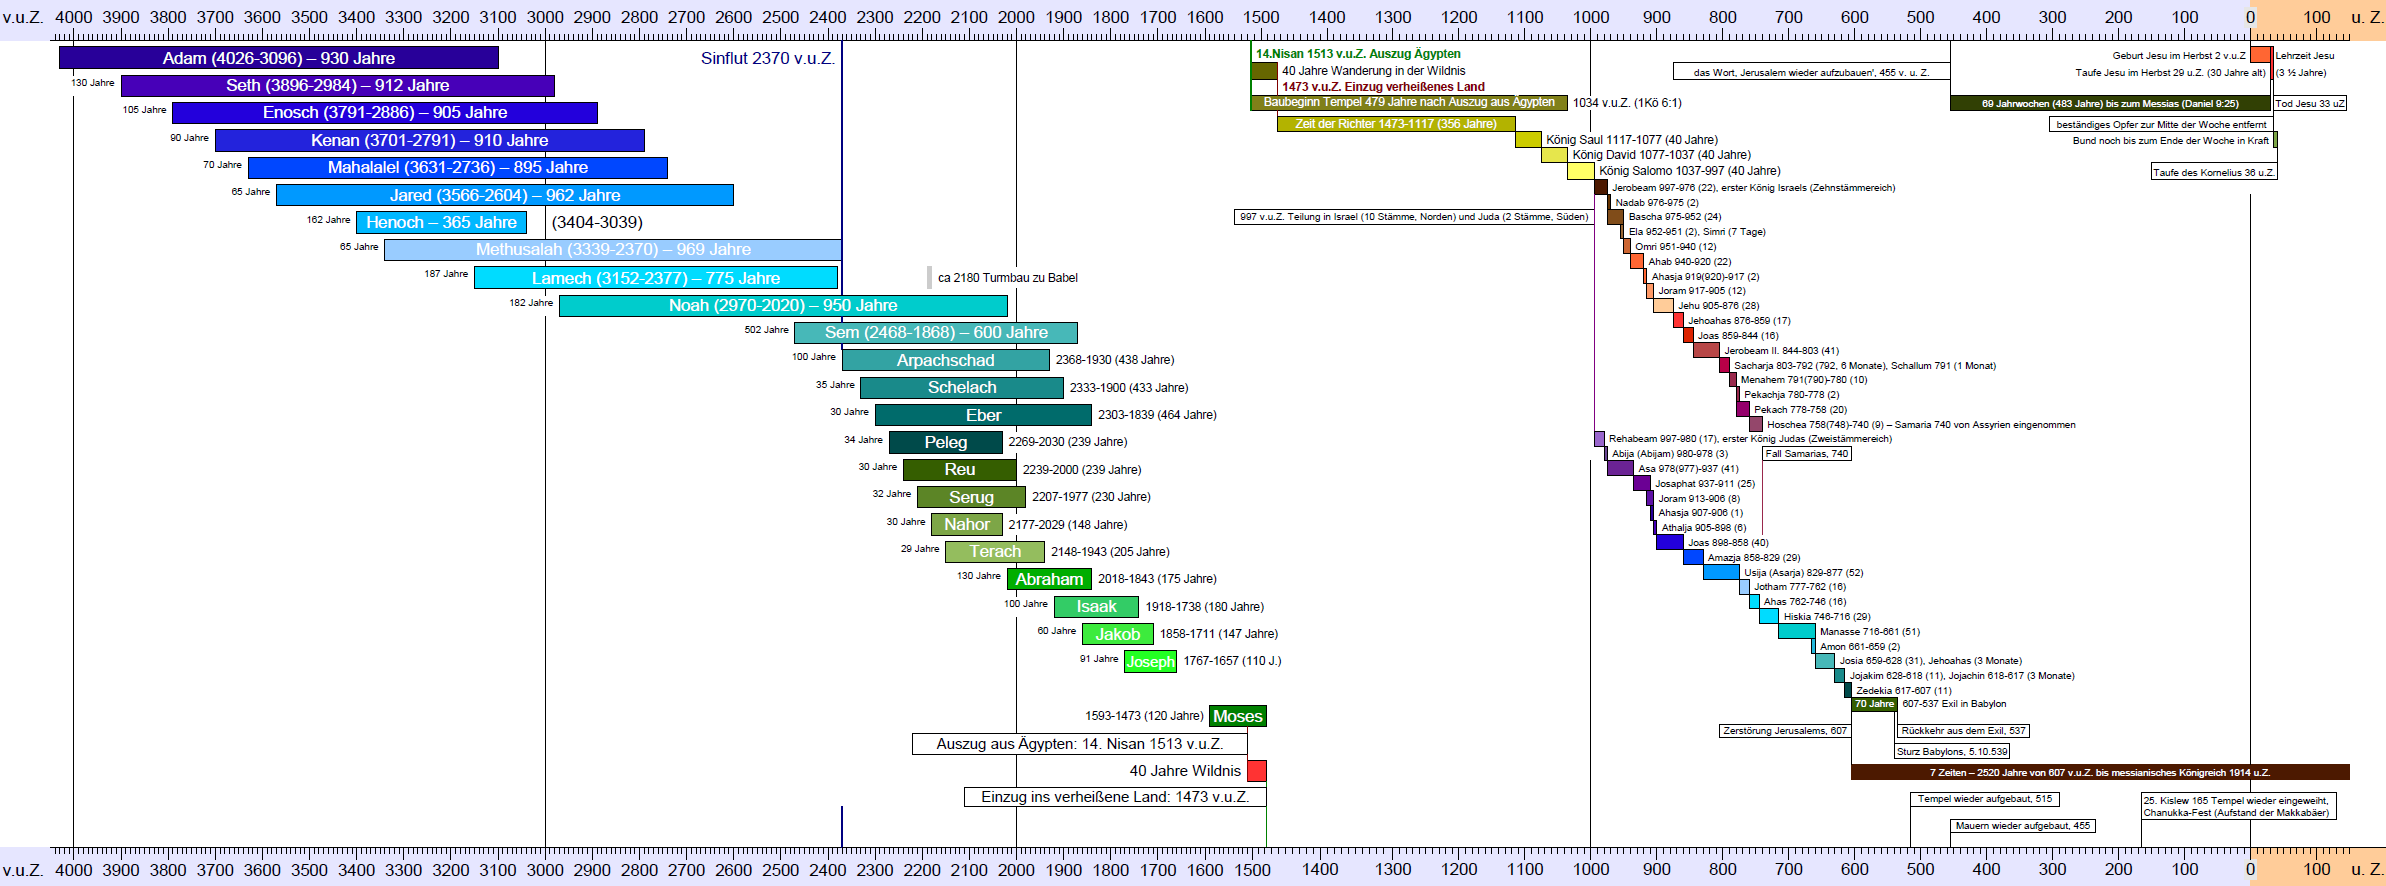
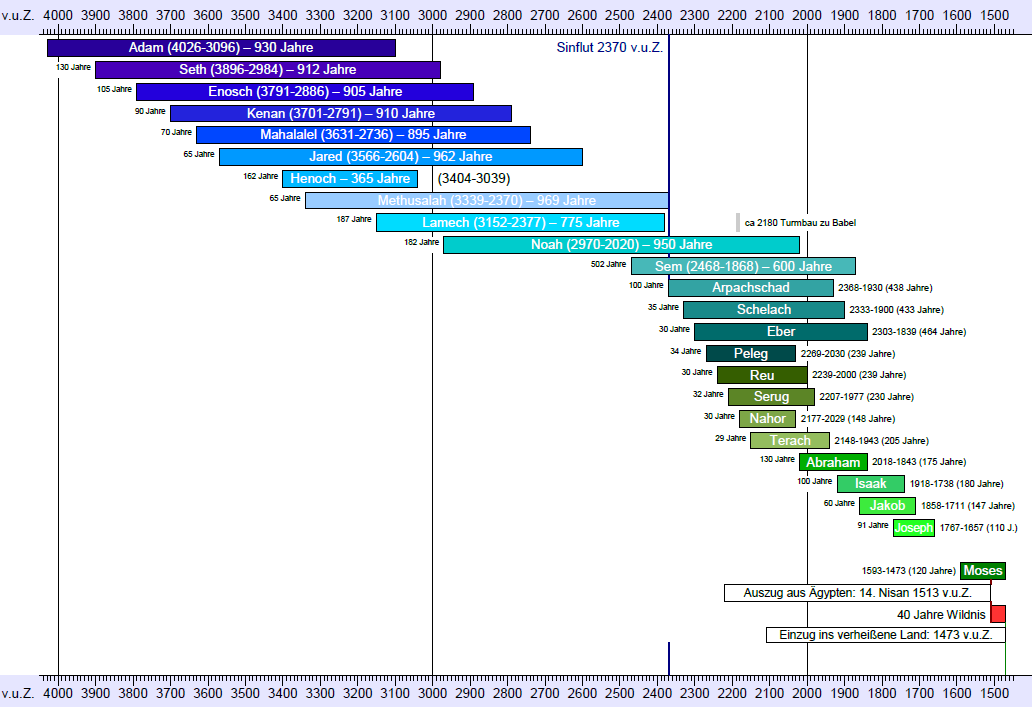
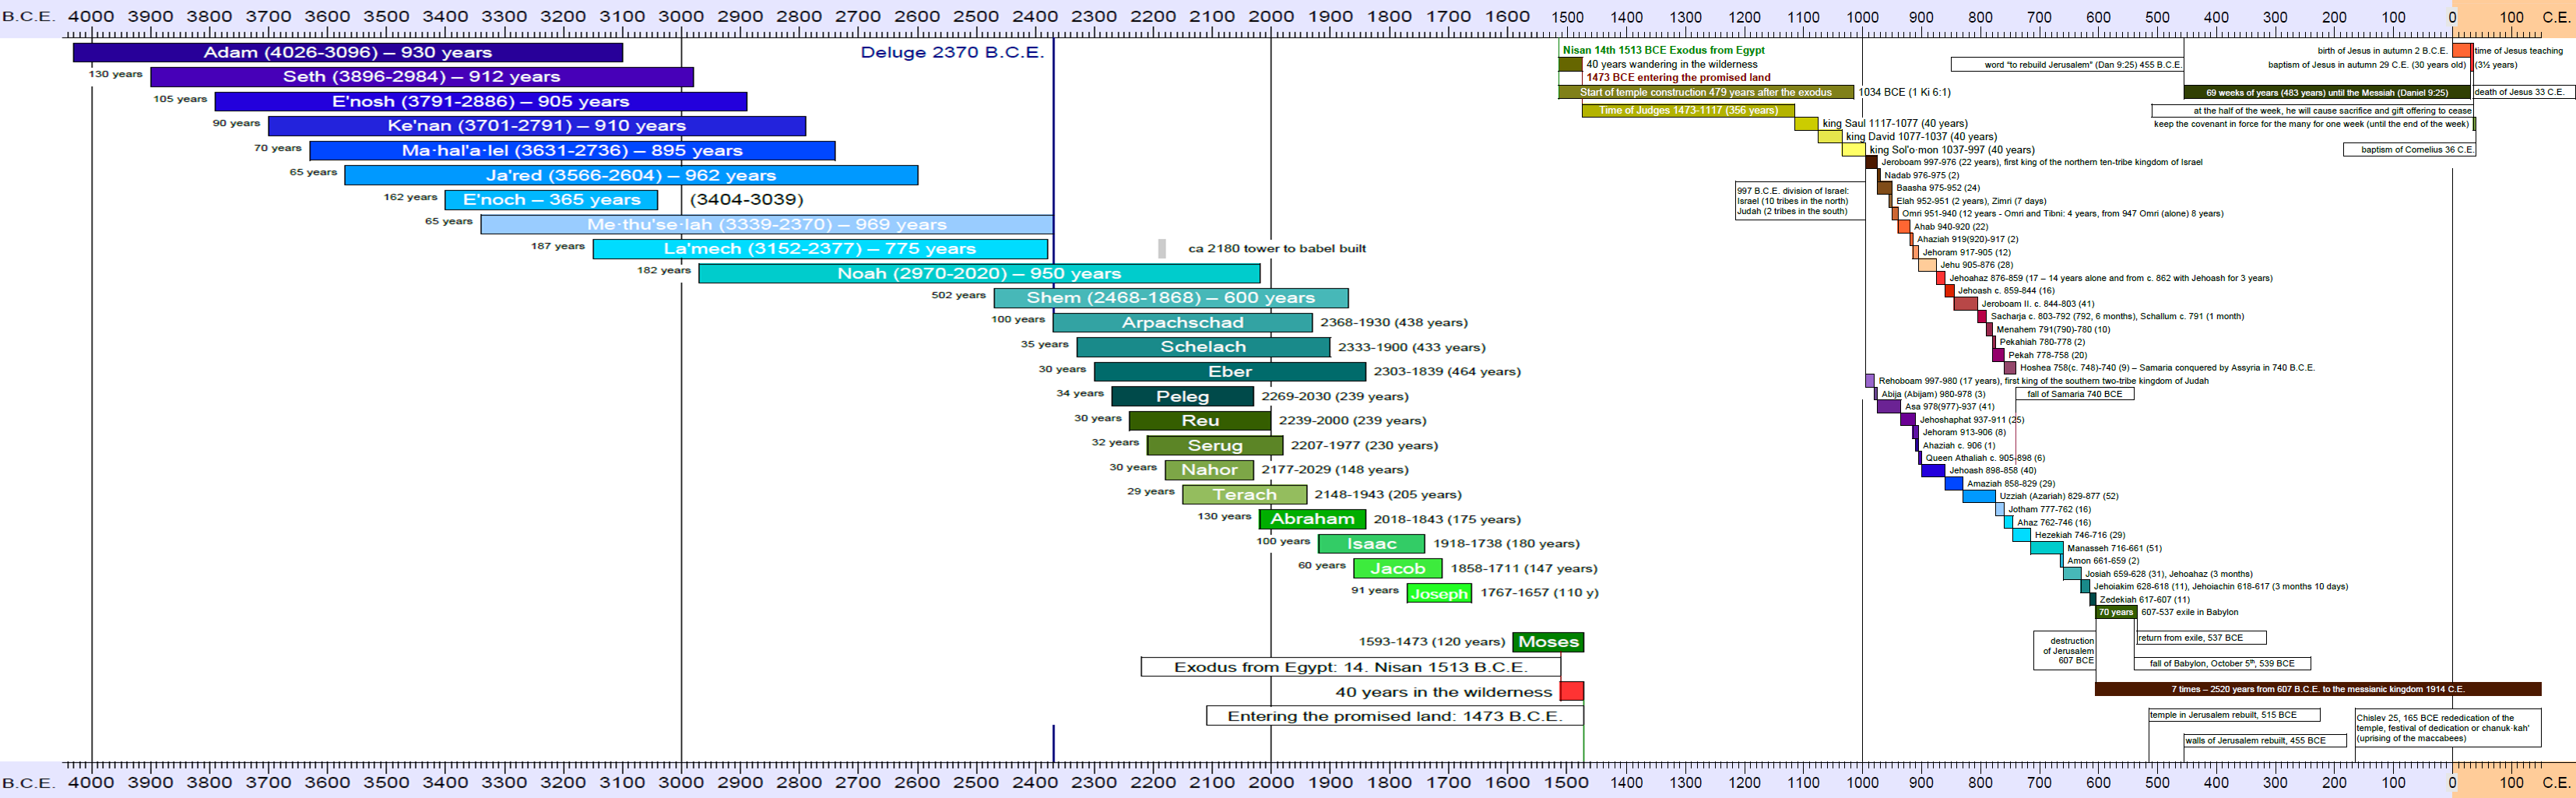
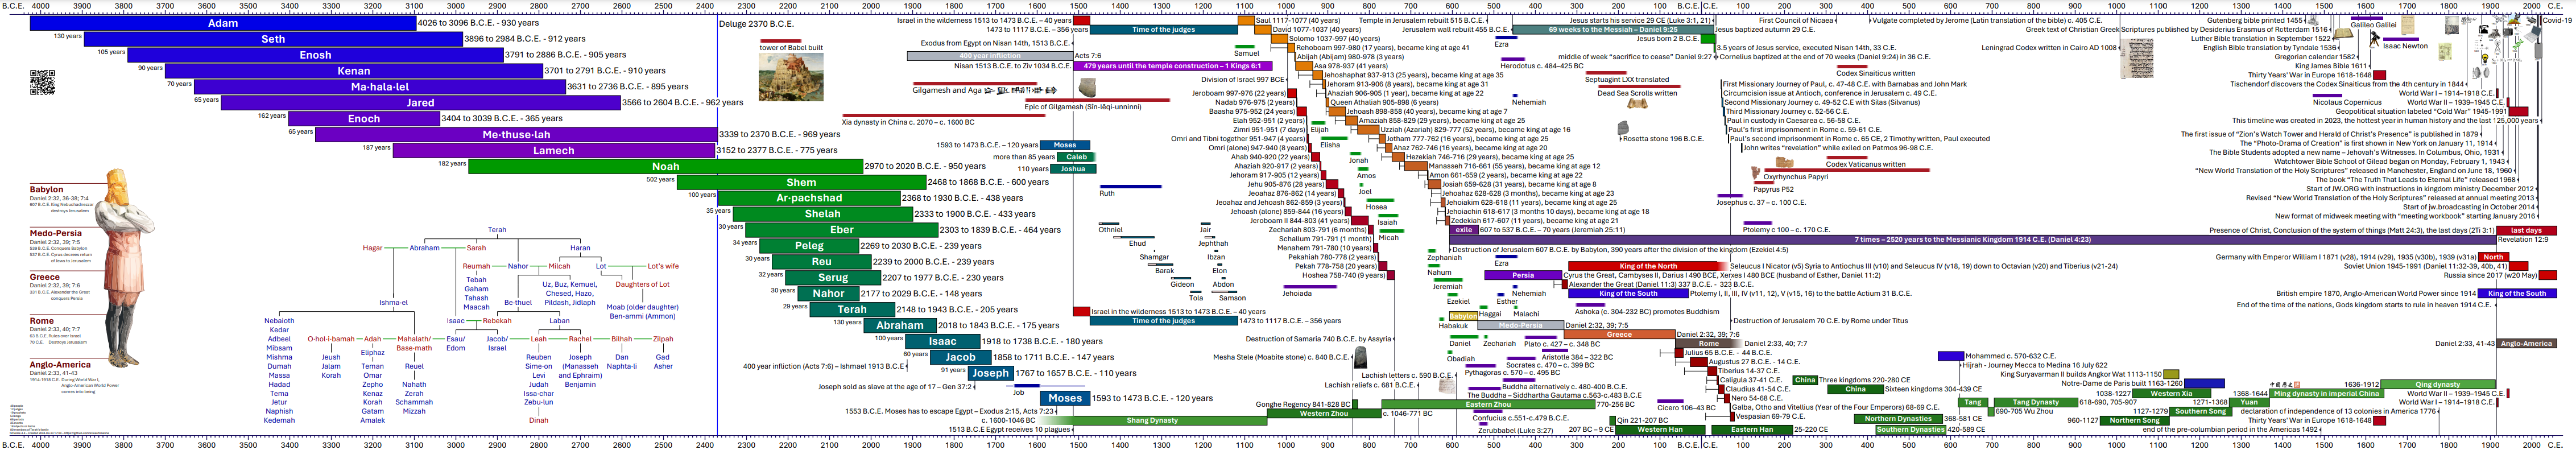
- Timeline 4026 BCE - 2050 CE to be stretched over four A4 landscape papers
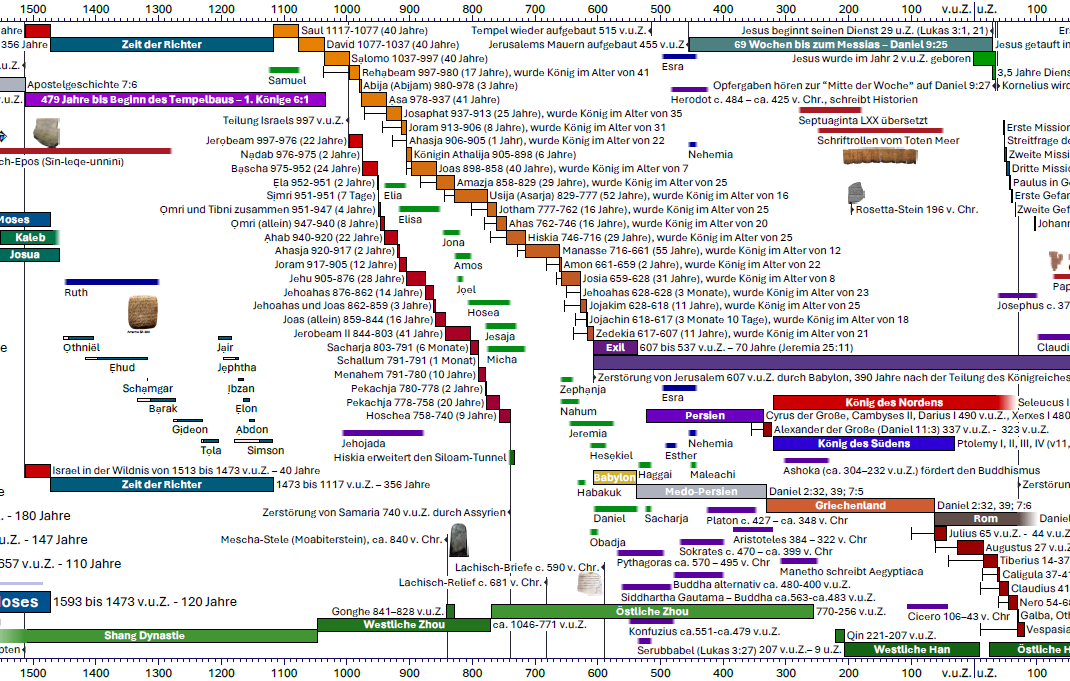
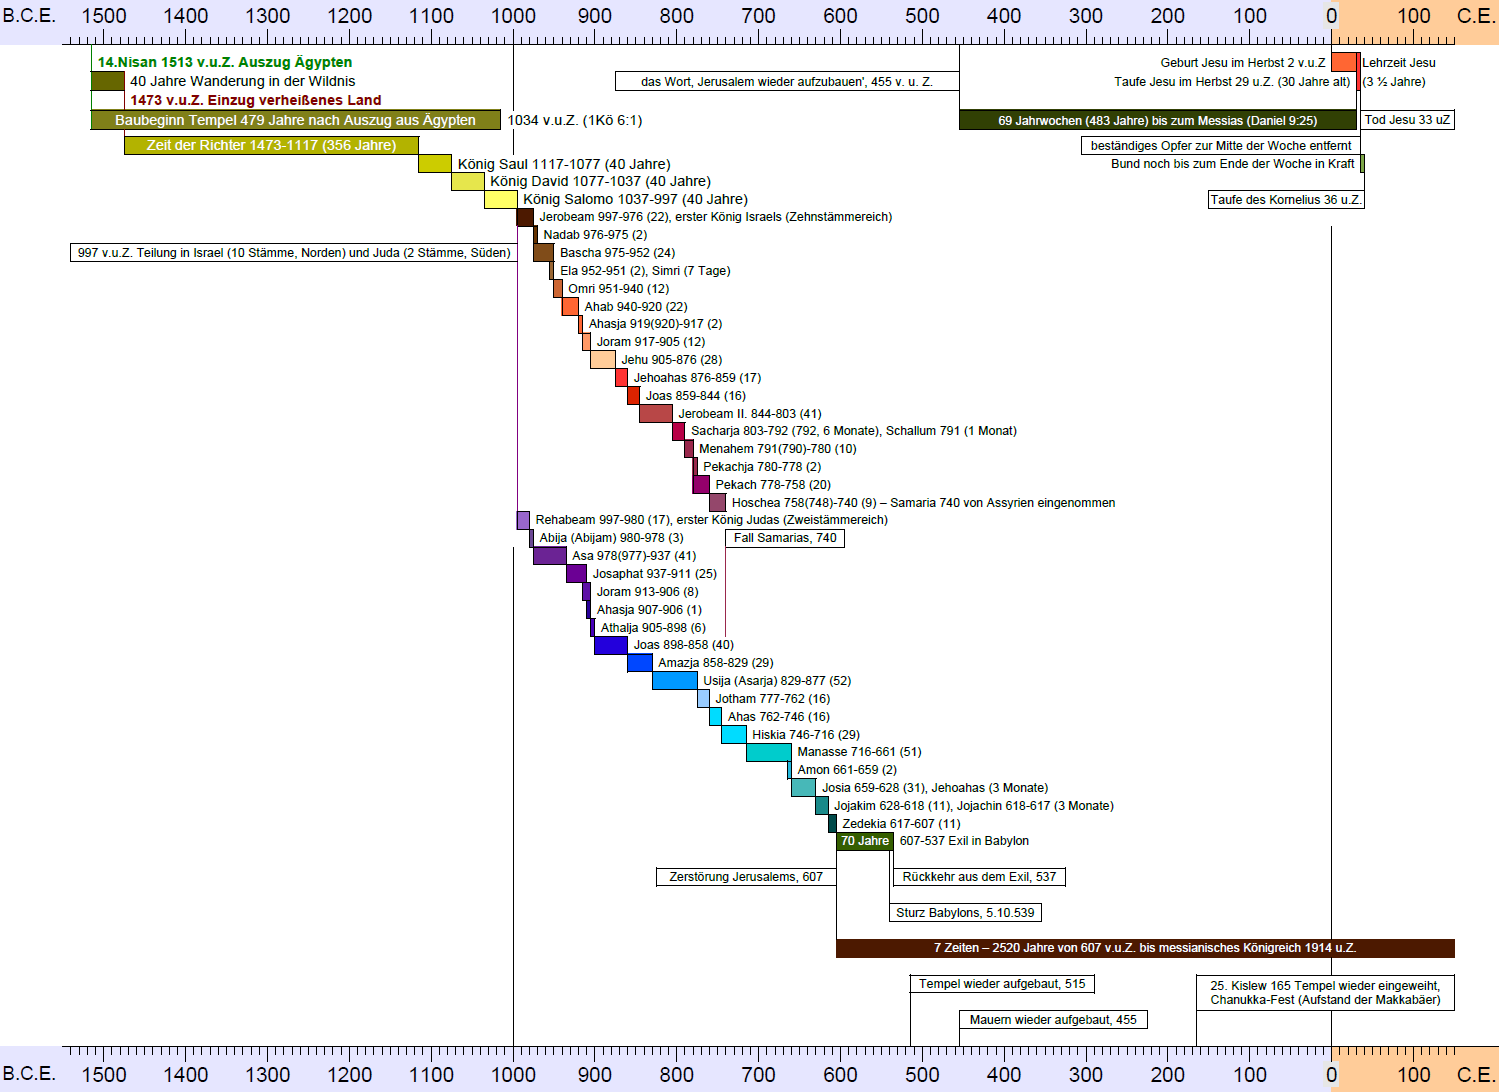
- Timeline 1000 BCE - 607 BCE, the kings in the two-tribe nation of Judah and the 10-tribe nation of Israel
But there are more things to consider. I started a digital timeline already in 2006. The following is a little history of my projects. Below follows a history of other timeline projects. Here an overwiew of the subheadings:
- v0.1 A digital timeline as html files in August 2006
- v1.0 Start with a spreadsheet in February 2009
- v2.0 Creating a Vector Image with .odg in October 2015
- v1.1 Translation of v1.0 to English in June 2023
- v3.0 Creation of an vector based version with python and reportlab in October 2023
- v4.0 Increase of version number to reflect the year in January 2024
- v4.7 Switch from reportlab to fpdf2 im May 2024
- v5.1 Include the period of 430 years
- v5.9 Extended family tree back to Noah and relate 20 nations in footnotes
- v6.01 Updated numbering system, Kain’s family
- Inspirations
- Comparison 2009 vs. 2024
v0.1 A digital timeline as html files in August 2006
The project to create a paper timeline of human history is done by teenagers around the world. I got an endless paper roll of 10 meters length to start this project, but decided to begin with a digital version. Late in 2025 I rediscovered that my first digital timeline was already created in 2006 as an html file, and not 2009 as previously thought. I created several different versions back then, and had a representative image on my homepage:

This includes a reference to the year 2006 (inside the html file itself with meta name=”date” content=”2006-08-30”), and the 30000 pixel wide (zeit2.html below - with the old encoding meta http-equiv="content-type" content="text/html; charset=iso-8859-1") ends for myself in 2005 and has a timestamp from 2006-08-30. For further details, here are the links (all in German):
- Original source: Projekte: 13. Zeitleiste der Menschheitsgeschichte
- 4100 v.u.Z. bis 2100 u.Z. auf 10000 Pixeln, 3 Zeilen, html and a local copy zeit1
- 4100 v.u.Z. bis 2100 u.Z. auf 30000 Pixeln, html and a local copy zeit2
- 4100 v.u.Z. bis 2100 u.Z. auf 3000 Pixeln, html and a local copy zeit3
- 4100 v.u.Z. bis 2100 u.Z. auf 6000 Pixeln, html from 2006/09/07 and a local copy of zeit4
- 4100 v.u.Z. bis 2100 u.Z. auf 3200x463 Pixeln, png-Grafik
- 4050 v.u.Z. bis 150 u.Z. auf 2386x886 Pixeln, png-Grafik
- And a vertical version of the timeline with linked people called zeitleiste1 and a local Github copy zeitleiste1, so far only 4 people are linked: Adam, Eva, Abel and Kain.
About the creation I noted: Da ich ein solches Projekt allein niemals schaffen würde, arbeiten jetzt gemeinsam an diesem Projekt: Dennis, Manuel, Matthias und Thomas.
The scale is rather large. An image of the 30000 pixel image scaled to 25% is still 7665 pixel wide and need 2 screenshots of my two FullHD monitors side-by-side. This is the result: below the stacked 10000 px zeit2.html (8027 at 80%) and zeit3.html (3369 px):

I also created a stacked version, “only” 10000 pixels wide. Here the zeit2.html (8027 at 80%):

And finally the zeit3.html (3369 px):

In 2006 I rendered the following image:
v1.0 Start with a spreadsheet in February 2009
On February 10th, 2009 I created a spreadsheet in OpenOffice 3.0 with 3 tabs for the time 4050-1450 BCE, 1550 BCE - 150 CE and 150-2050 CE. All are designed to fit on a A4 paper, so these 3 pages can be glued together for a single timeline spanning 6000 years.
4050 - 1450 BCE
For these 2600 years I chose a resolution of 10 years. The spreadsheet has 260 columns, but for the long periods of this time it is precise enough.
1550 BCE - 150 CE
The resolution of only 10 years makes it difficult to visualize shorter time perios like the 2 years that Pekachja ruled Israel from 780-778 BCE or the one year that Ahasja ruled Juda 907-906 BCE. The second tile therefore is divided into columns for 5 years and needs 340 columns for the 1700 years from 1550 BCE to 150 CE.
130 BCE - 2050 CE
The third tile went back to 10 years per column and needs 218 columns.
v2.0 Creating a Vector Image with .odg in October 2015
The use of a spreadsheet really limits the possible resolution of the final product, being digital or a printed pdf. Here is a comparison of the resolution of my various approaches:
| page | begin | end | timespan | width/mm | years/mm | resolution | columns | created |
|---|---|---|---|---|---|---|---|---|
| table 1 | -4050 | -1450 | 2600 | 277 | 9.39 | 10 | 260 | 2009-02-10 |
| table 2 | -1550 | 150 | 1700 | 277 | 6.14 | 5 | 340 | 2009-02-10 |
| table 3 | -130 | 2050 | 2180 | 277 | 7.87 | 10 | 218 | 2009-02-10 |
| drawing odg | -4000 | 2000 | 6000 | 1250 | 4.8 | ∞ | ∞ | 2015-12-13 |
| reportlab python | -4050 | 2050 | 6100 | 1168 | 5.22 | ∞ | ∞ | 2023-10-17 |
As next step I started to create a vector image that could be exported as pdf with the ability to zoom into details. On October 12, 2015 I started a LibreOffice 4.4 Drawing ODG with a scale of 1cm for 50 years or 5 years/millimeter, resulting in a document with the dimensions 1250x297 mm. This could be printed on my endless A4 paper roll. Last export as pdf on December 13, 2015.
v1.1 Translation of v1.0 to English in June 2023
The original files from 2009 were created in German. Starting summer 2017 most of my life was going on in English. When sharing this project with friends in early June 2023 I promised to have the translated version ready until the end of month. And the translation was inded completed by June 30th, 2023.
Some black/white copies were print out and shared for feedback. Yet the back of my mind was thinking of an elegant way to make v2.0 come to life.
v3.0 Creation of an vector based version with python and reportlab in October 2023
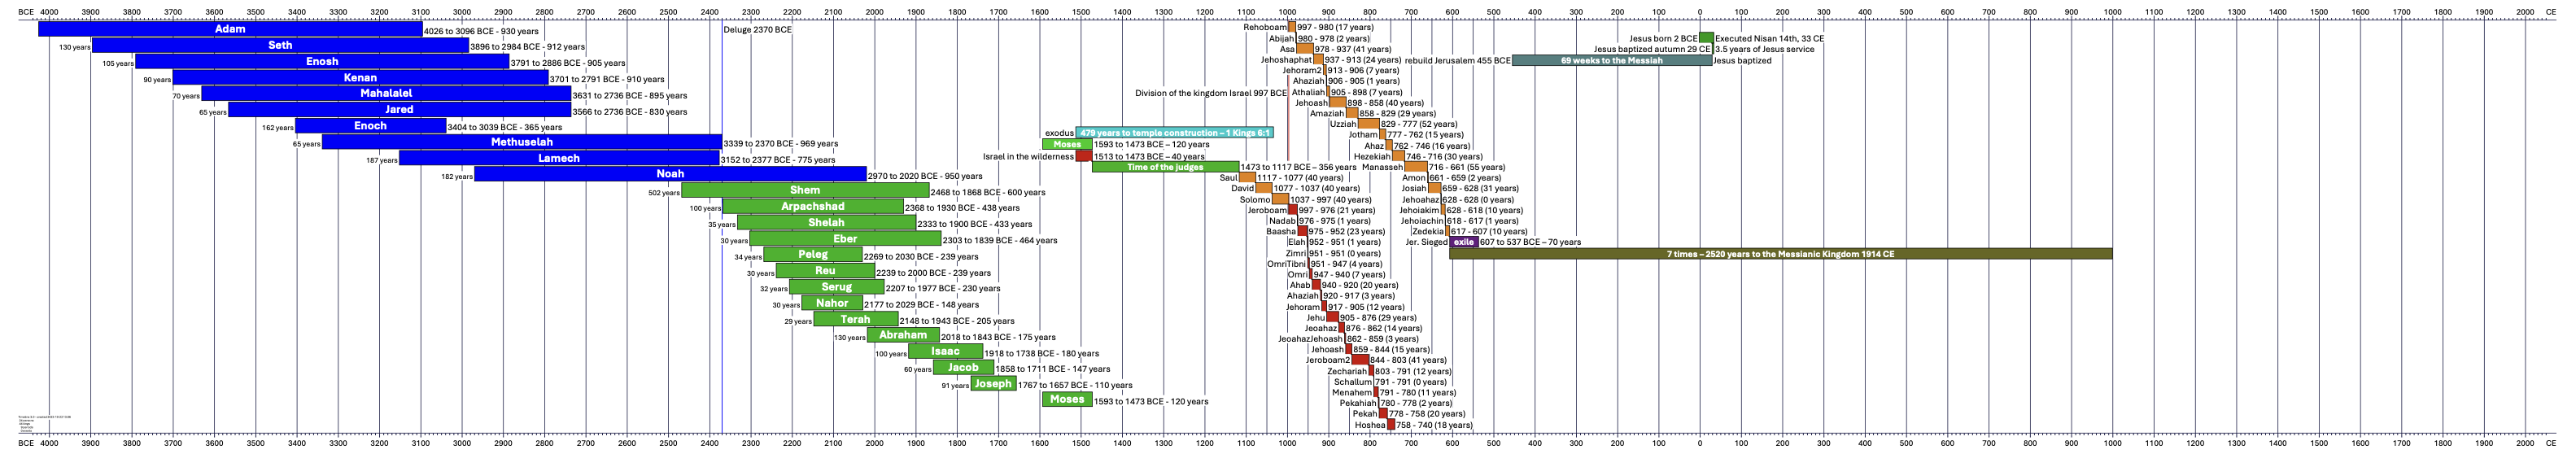
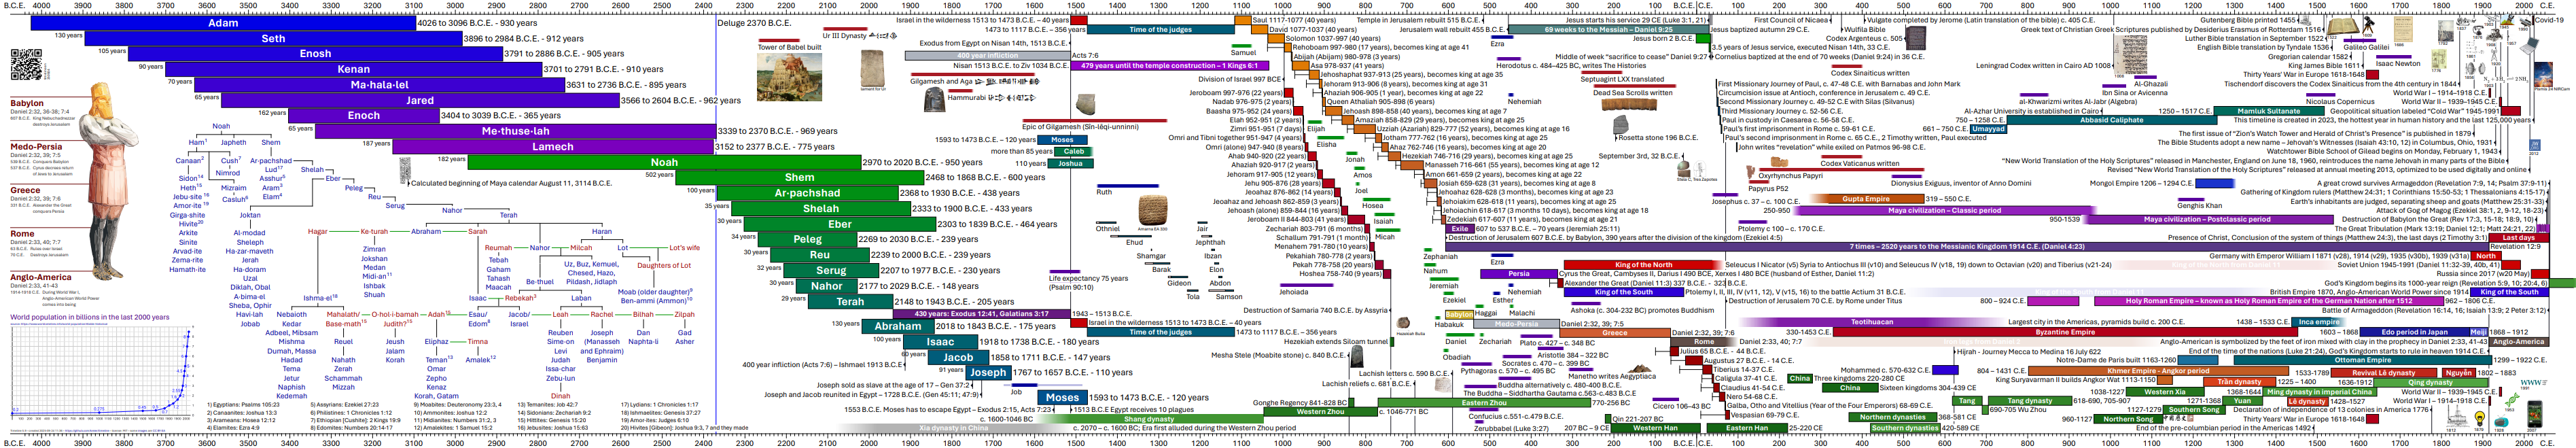
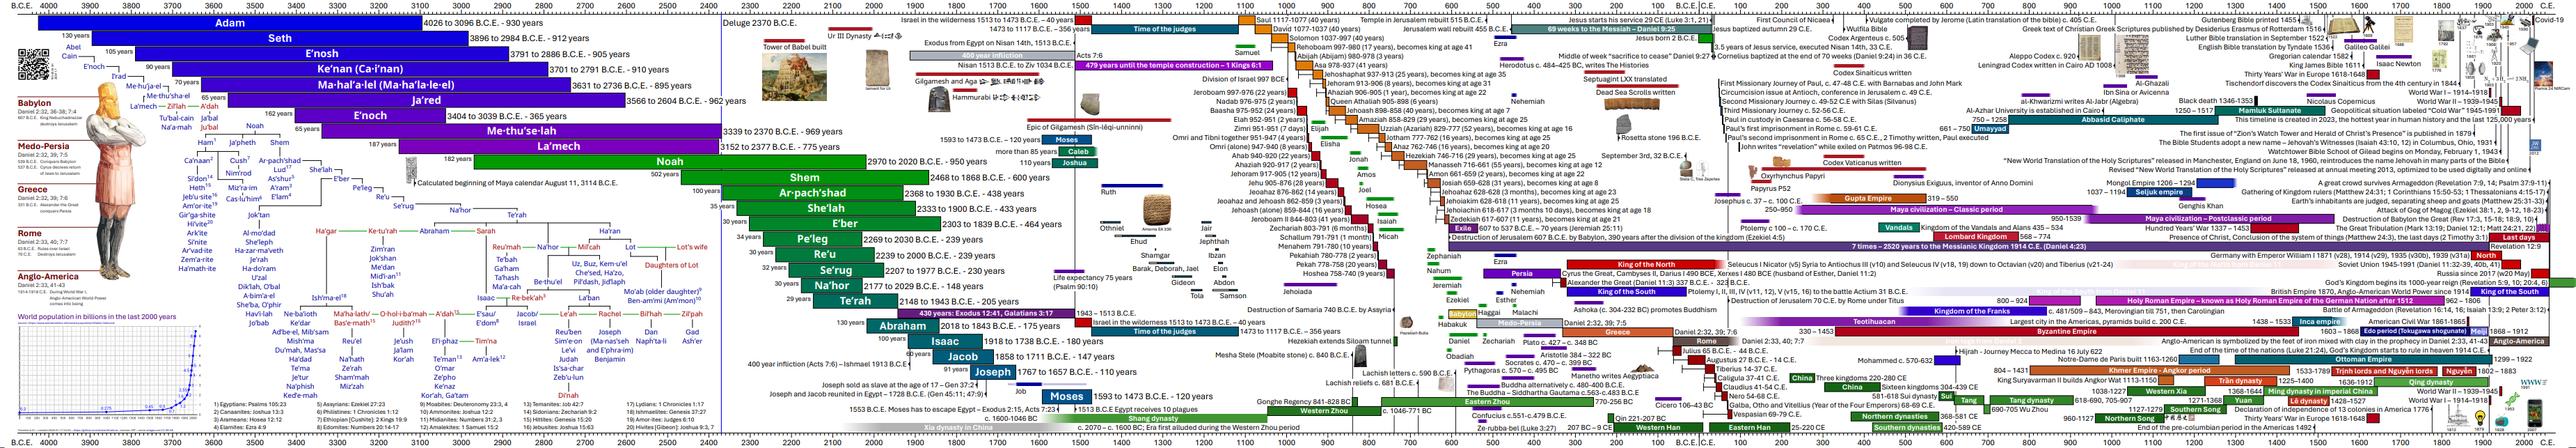
After starting to write programs in python in 2018 and teaching it from 2022 on this looked like a good project to apply these skills. Reading values from a .csv data file would make the creation process much easier and structured. In early October 2023 I finally got reportlab working with python on both macOS and a WSL installation on Windows 11. The first step was to recreate the two pages from libreoffice with this new method. The targeted size is now 4 pages of A4 in landscape combined. This could be printed with the poster function or given to a professional printer to be released on one A0 paper and creating 4 timelines.
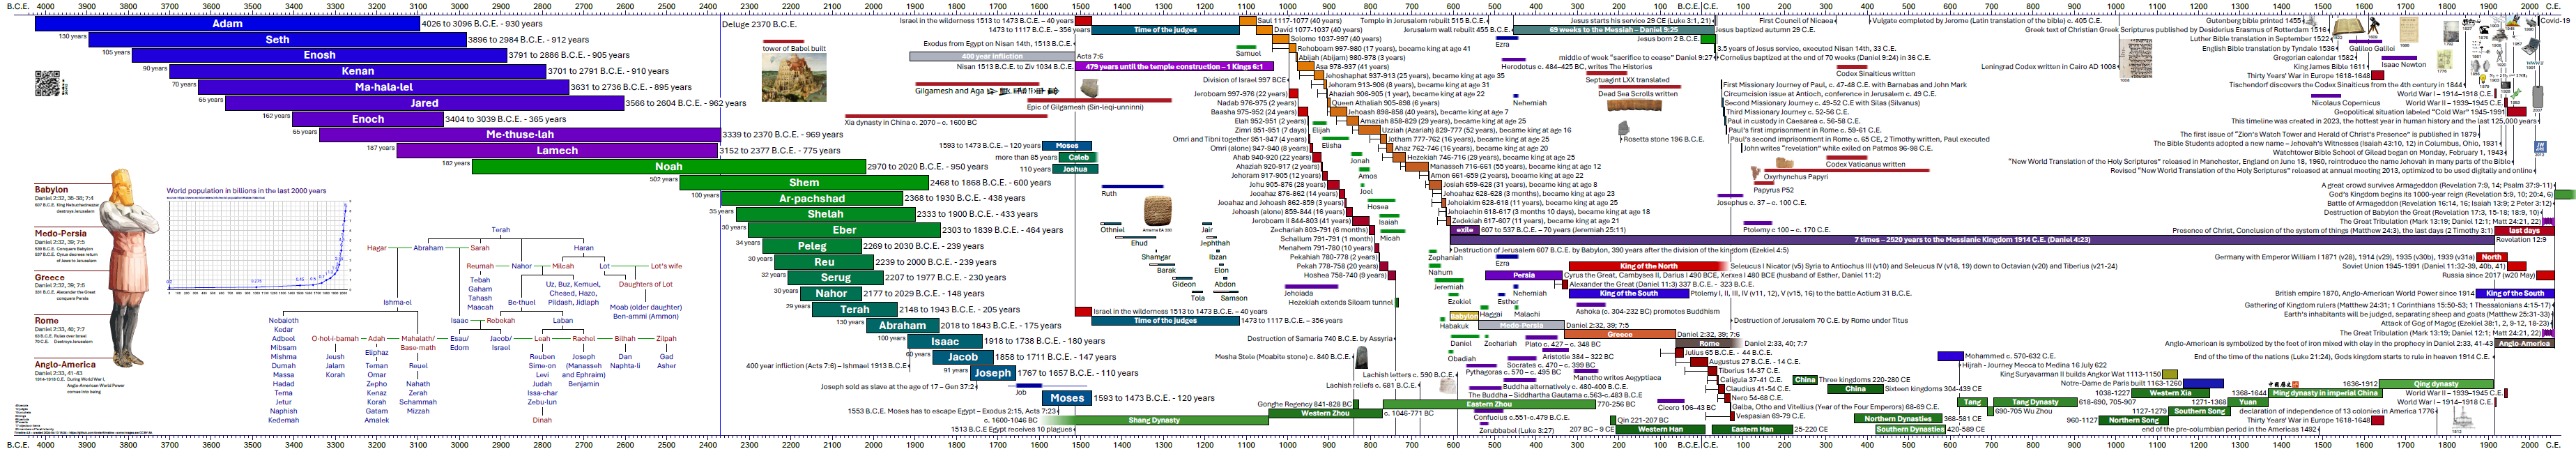
The current edition is v3.5. Early October I wrote “Hopefully by end of October 2023 this is done.” That might be true for the initial edition, but the more you work with the document, the more ideas you get. See the growing content from v3.0 in October to v3.5 in November 2023:
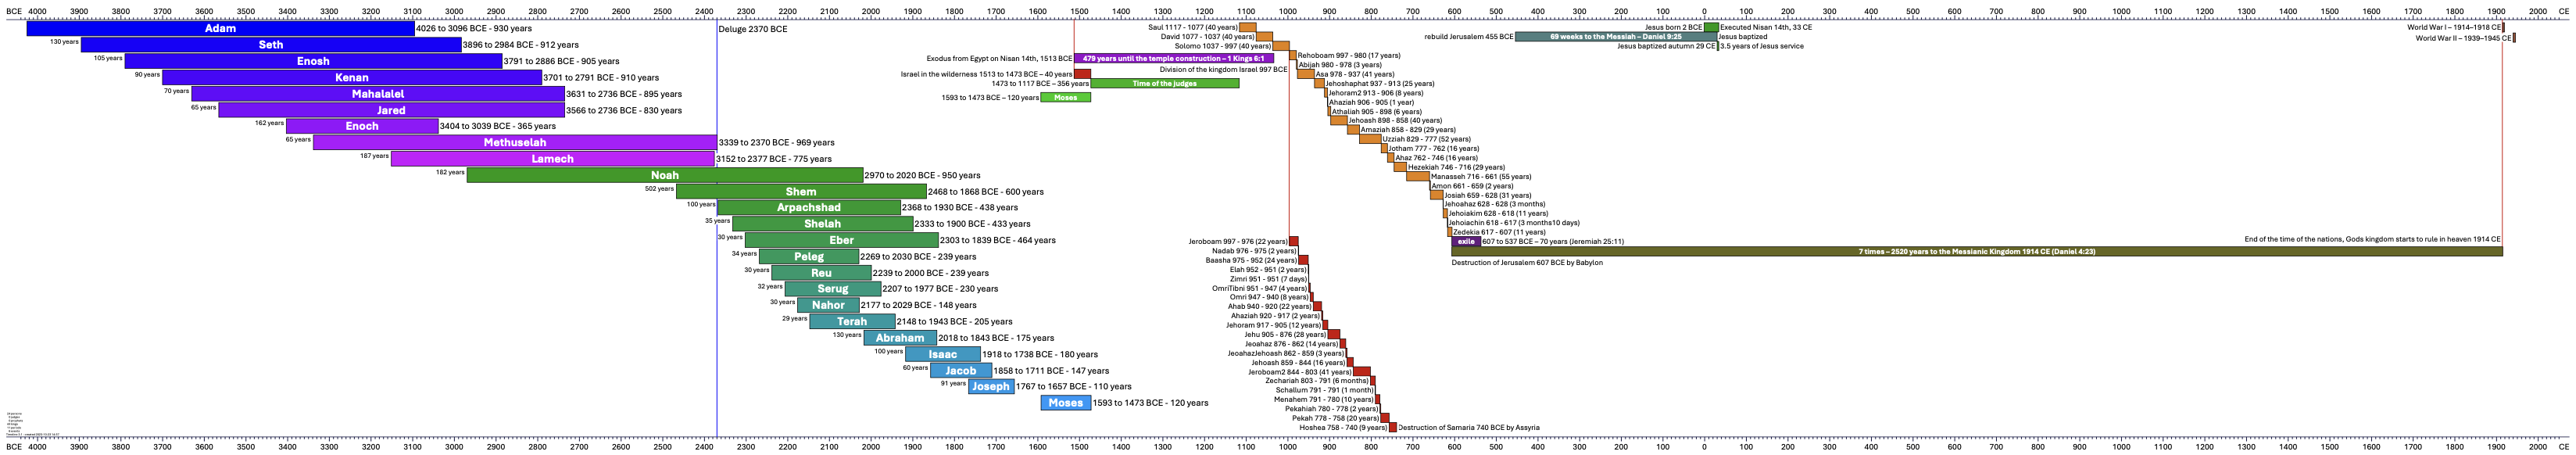

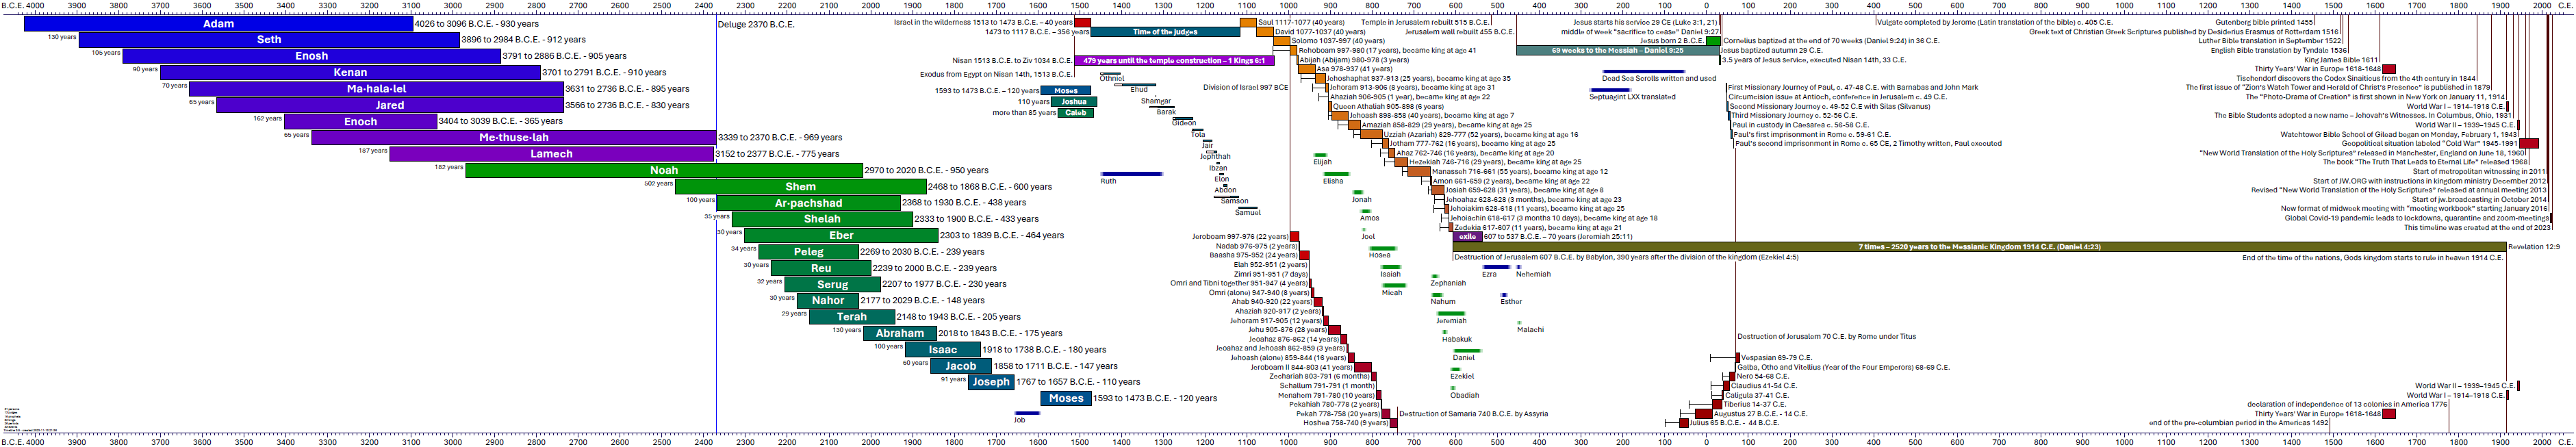
Since v3.4 it is also translated to German, with v3.5 a Vietnamese translation was added. And the respective translations have to be extended with each new detail added. The latest addition above includes the king of the North and South from Daniel 11.
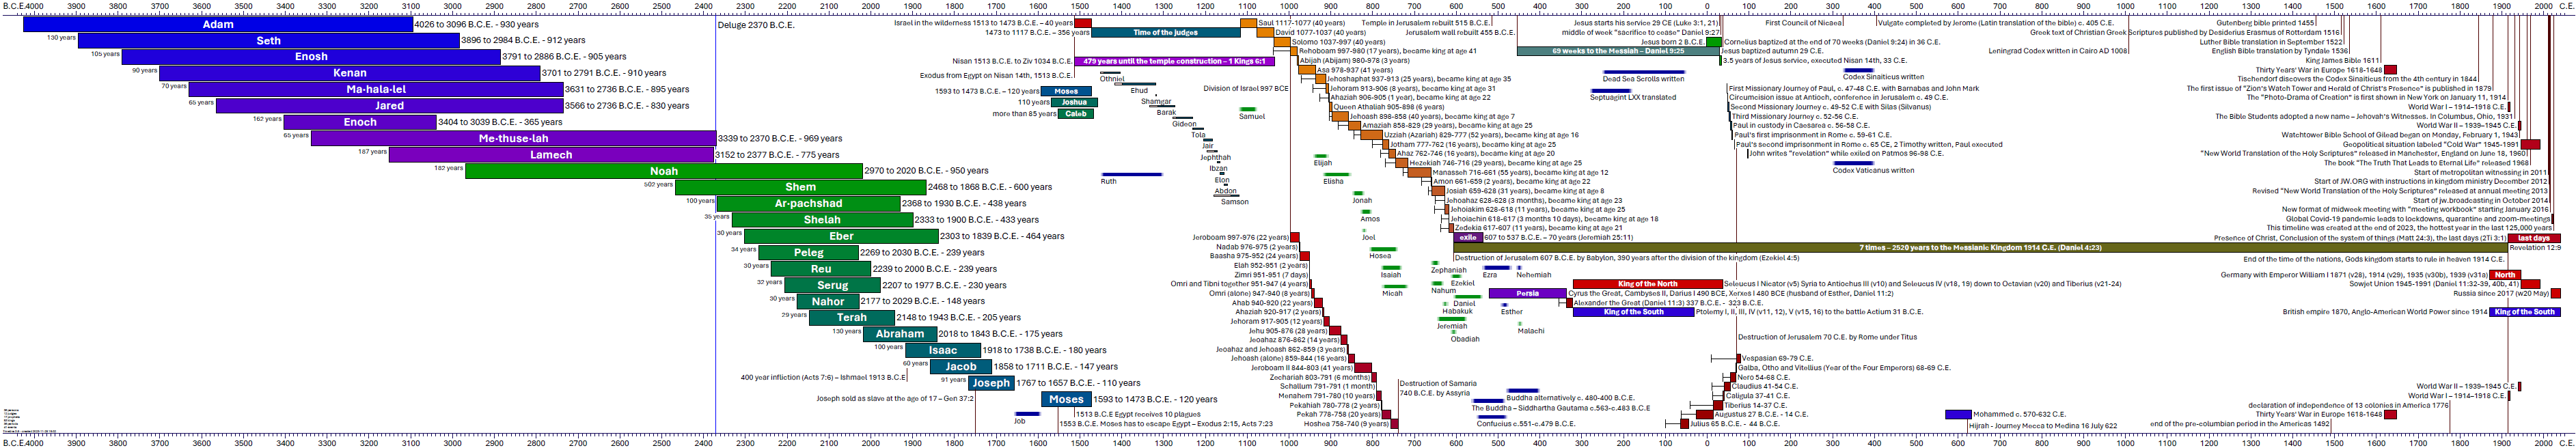
v4.0 Increase of version number to reflect the year in January 2024
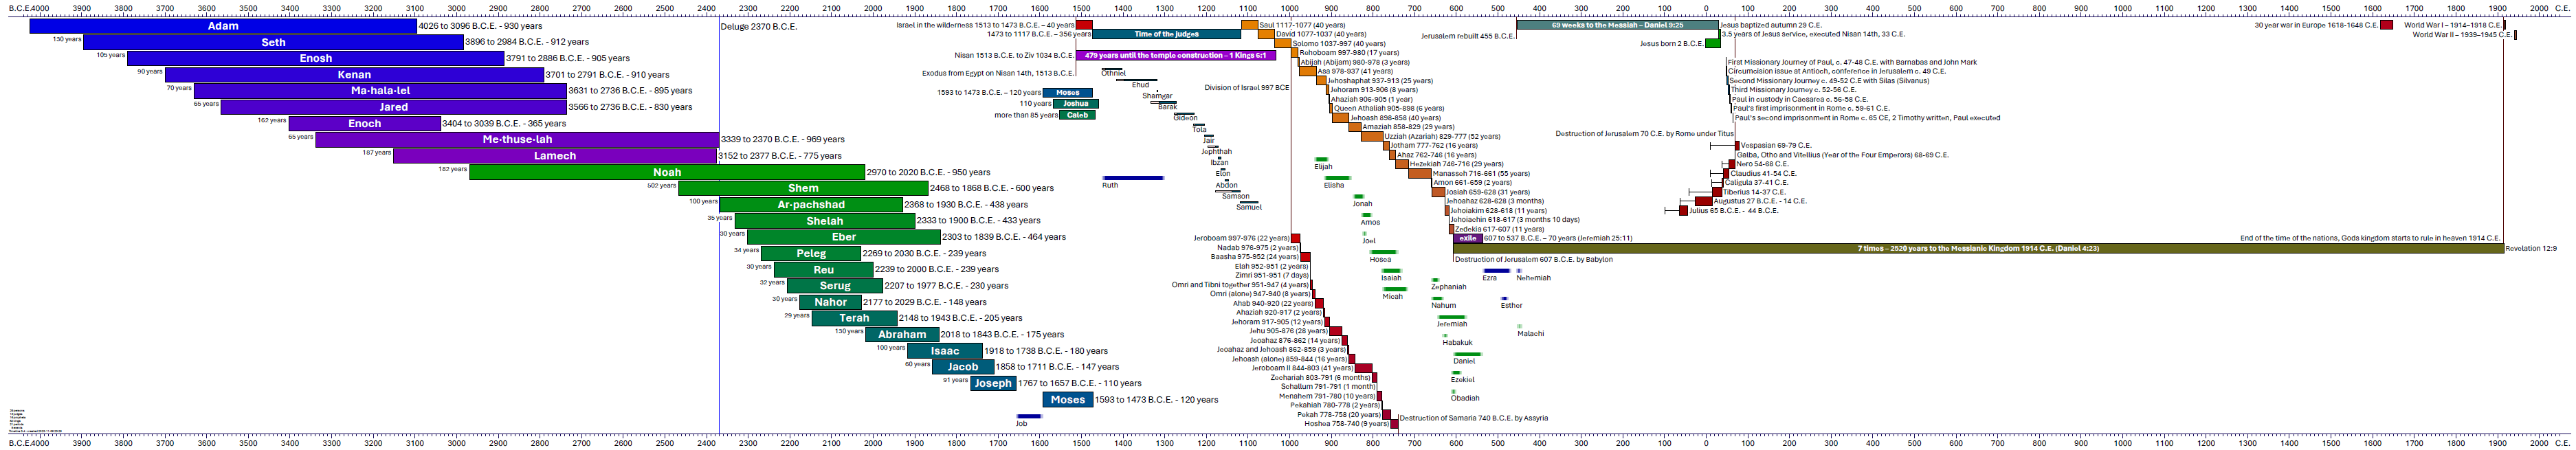
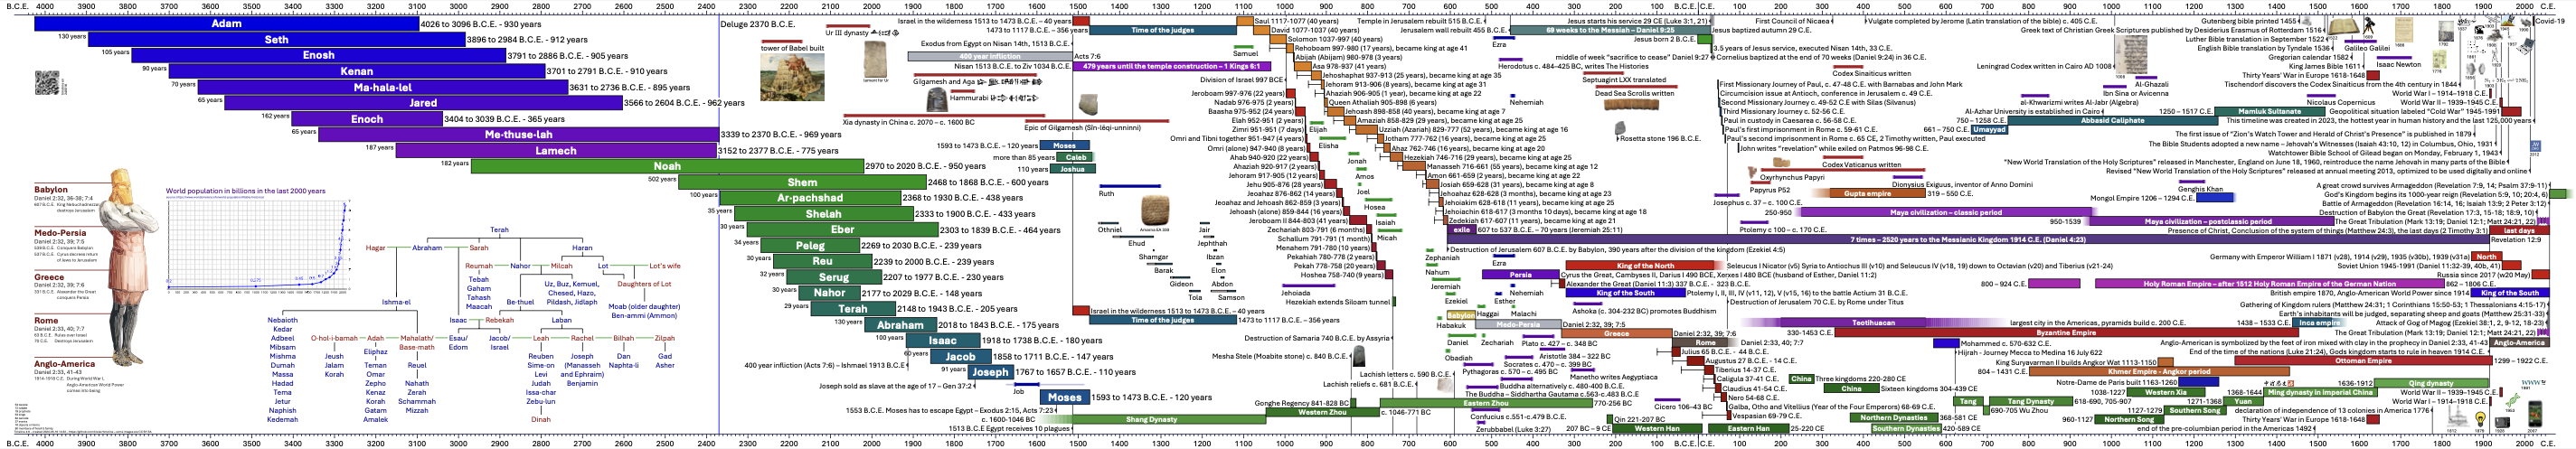
To reflect the year of the timeline edition for at least the next 6 years I simply use the last digit of the year as the leading version indicator. In 2030 this might change to a two-digit version number, if I’m still working on this project. Here we start with v4.0 from January 2024 with extended language and script support:
v4.7 Switch from reportlab to fpdf2 im May 2024
For 8 months I have been using the reportlab library in python to create the pdf files with the timeline. With a good documentation and support for utf-8 we were able to create the documents with embedded pixel and vector graphics. But by May 2024 I reached a limit of this package: the support for Text Shaping, especially the Glyph substitution is not implemented yet. The challenge is known for some time, but it requires significant manpower to implement properly. I documented my findings in issue #35. I tried other solutions like:
- fpdf as Free PDF in PHP on github since 2015, but started in 2001 by Olivier Plathey - currently at version 1.86
- pdfkit library for Node.js in the browser, on Github with 756 comits and 9600 stars, 16 releases since 2014, latest 0.15.0 from March 2024
- PyMuPDF for data extraction and more, on Github with 2399 commits and 4300 stars, 144 releases since 2015, latest 1.24.4 from May 2024
- weasyprint mainly to convert HTML to PDF, a professional product with good documentation on Github with 5548 commits and 6700 stars, 71 releases since 2016, latest v62.1 from May 2024 - yet as font subsetter Harfbuzz is currently experimental
- iText Core with pdfCalligraph as add-on for fonts like Arabic, Hebrew or Khmer, in Java; on Github with 6246 commits and 1900 stars, 41 releases since 2016, latest 8.0.4 Community from April 2024
- reportlab with sourcecode mirrored on Github - all the way back to 2000 with version 0.85, 2.0 in 2006, 3.0 in 2014 and currently at 4.2.1
Interestingly, fpdf2 itself is a fork from PyPDF from reingart/pypdf 2016, itself being a fork of the fpdf library by Max Pat in 2006. See a little history. The release history indicates that Text Shaping was only introduced with 2.7.5 in August 2023. Now with 1479 commits and 969 stars, 33 releases since 2021, the latest being 2.7.9 from May 2024.
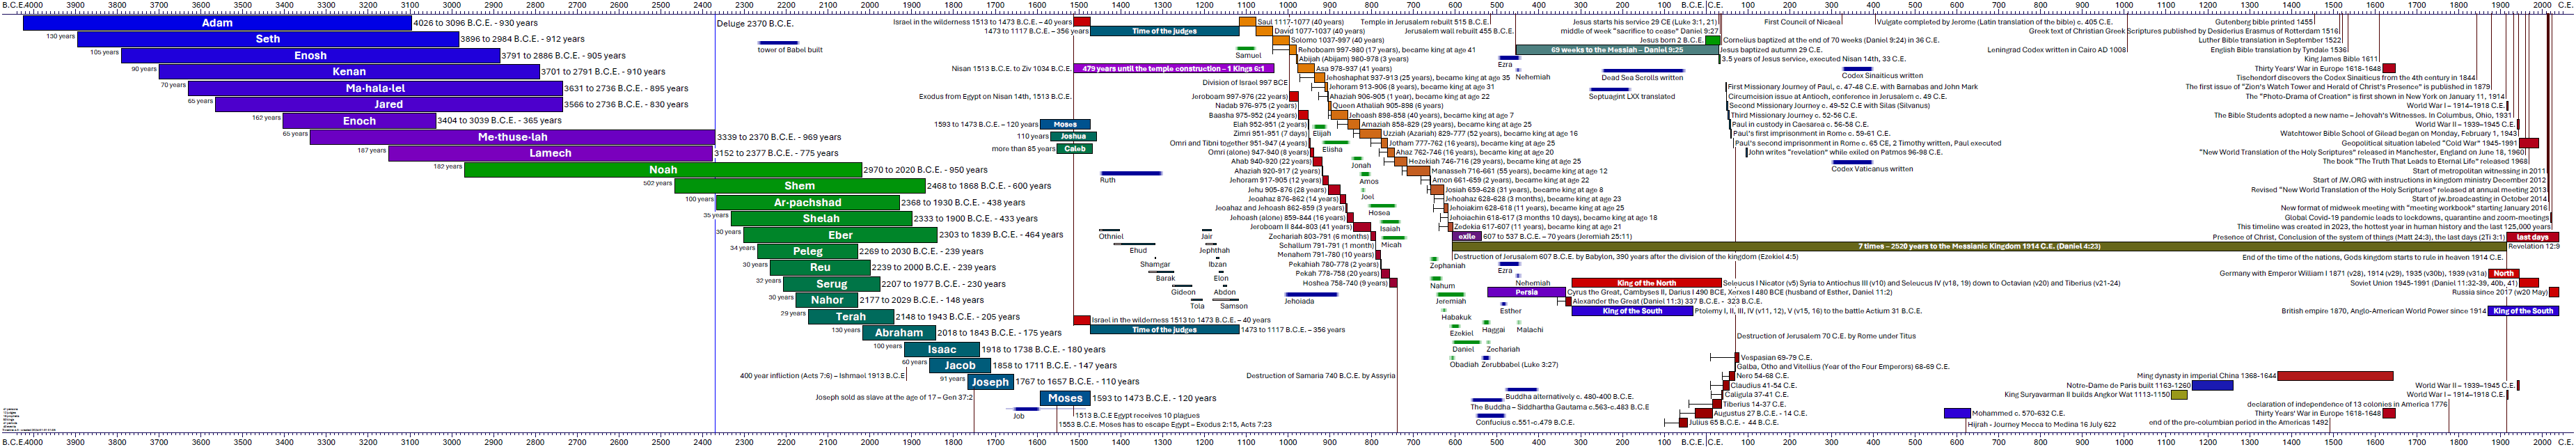
v5.1 Include the period of 430 years
The time period of 430 years was included as a graph. And some exaples from the Maya calender were included.
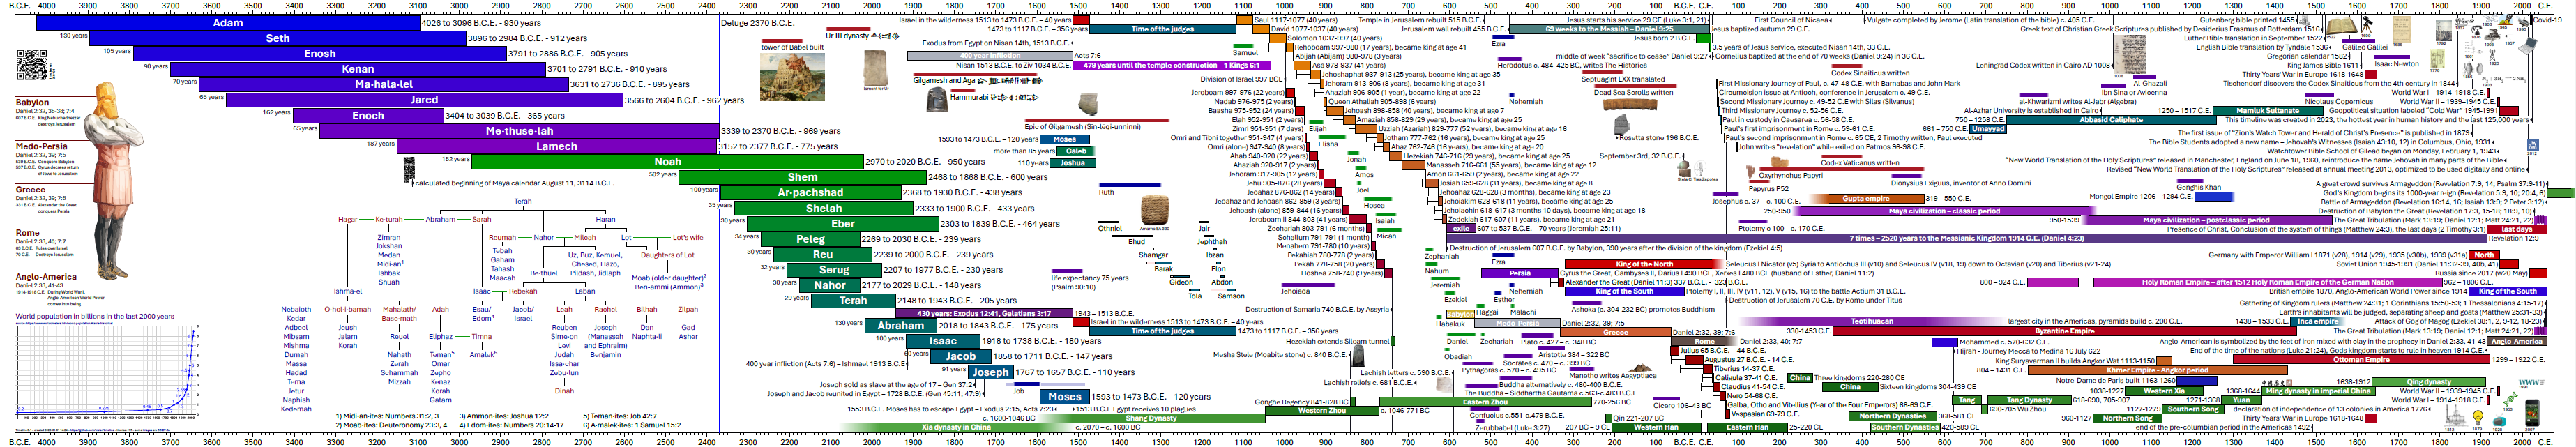
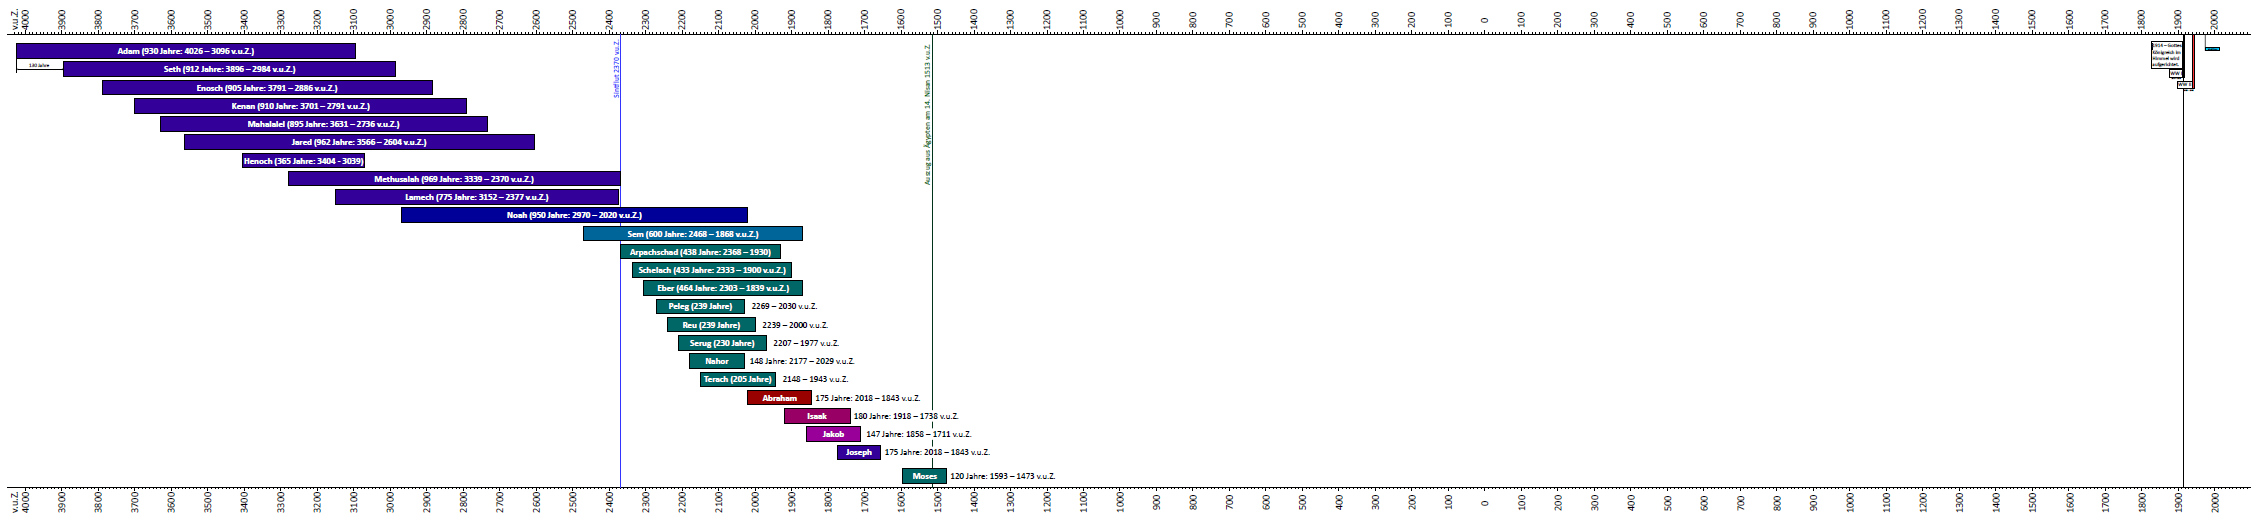
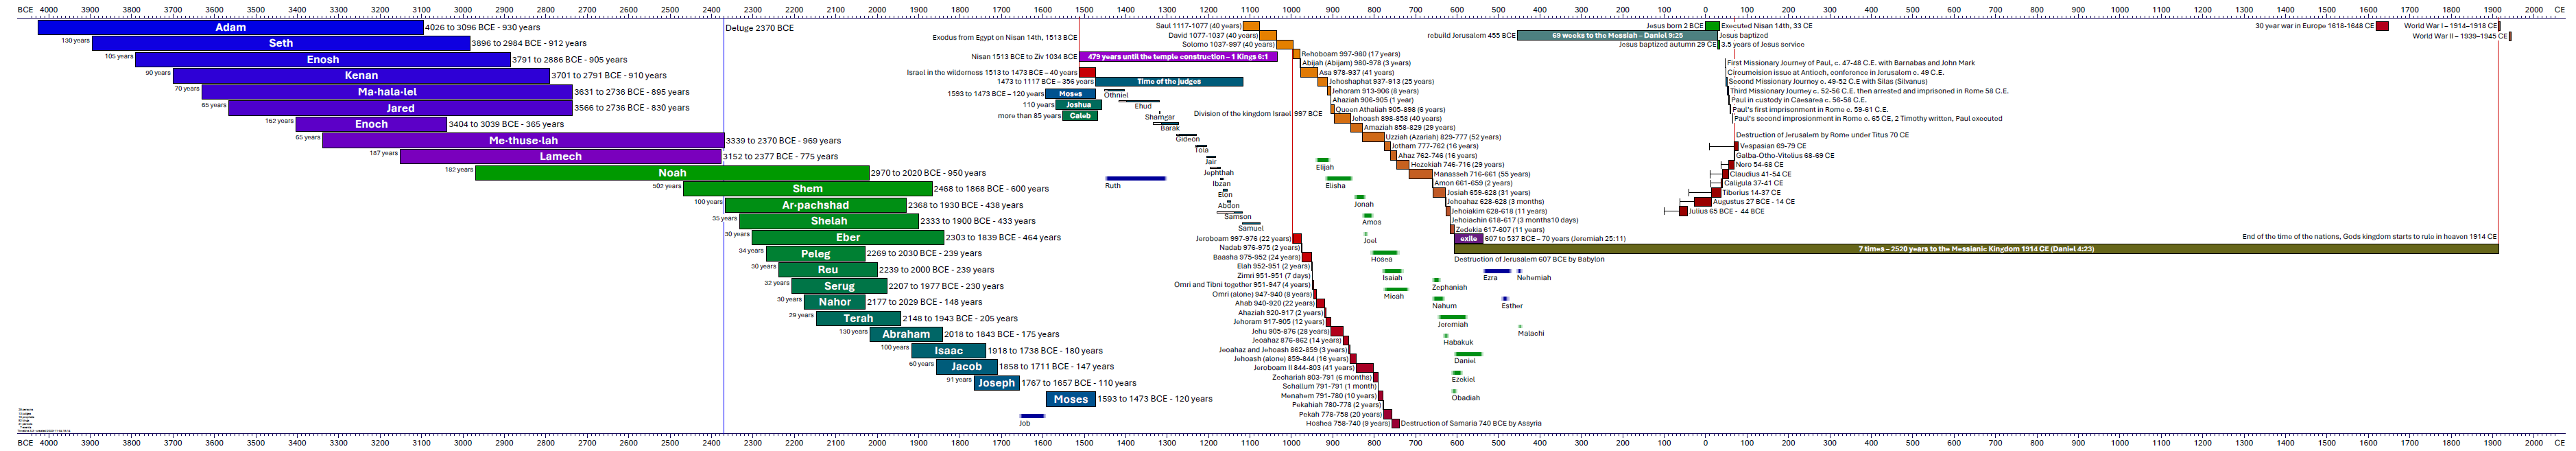
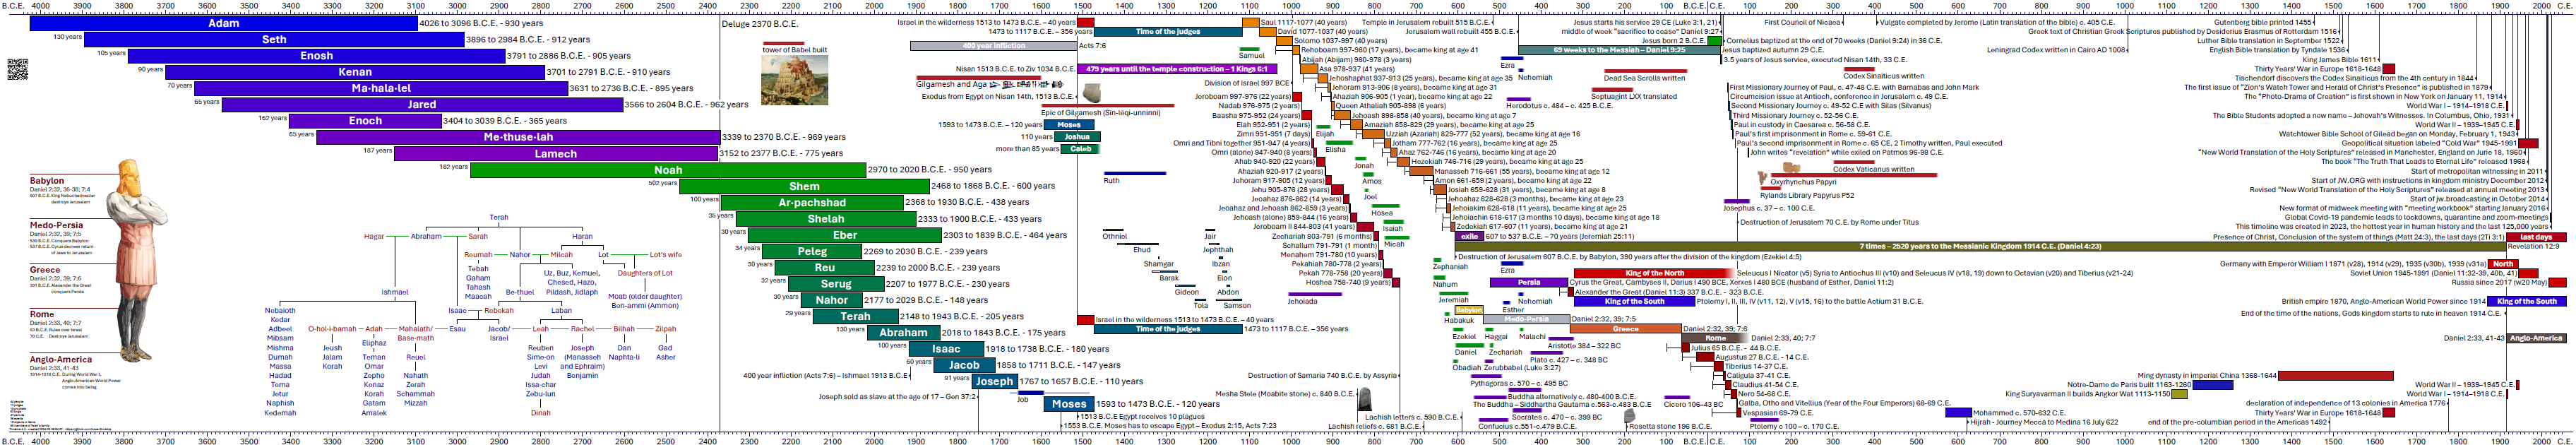
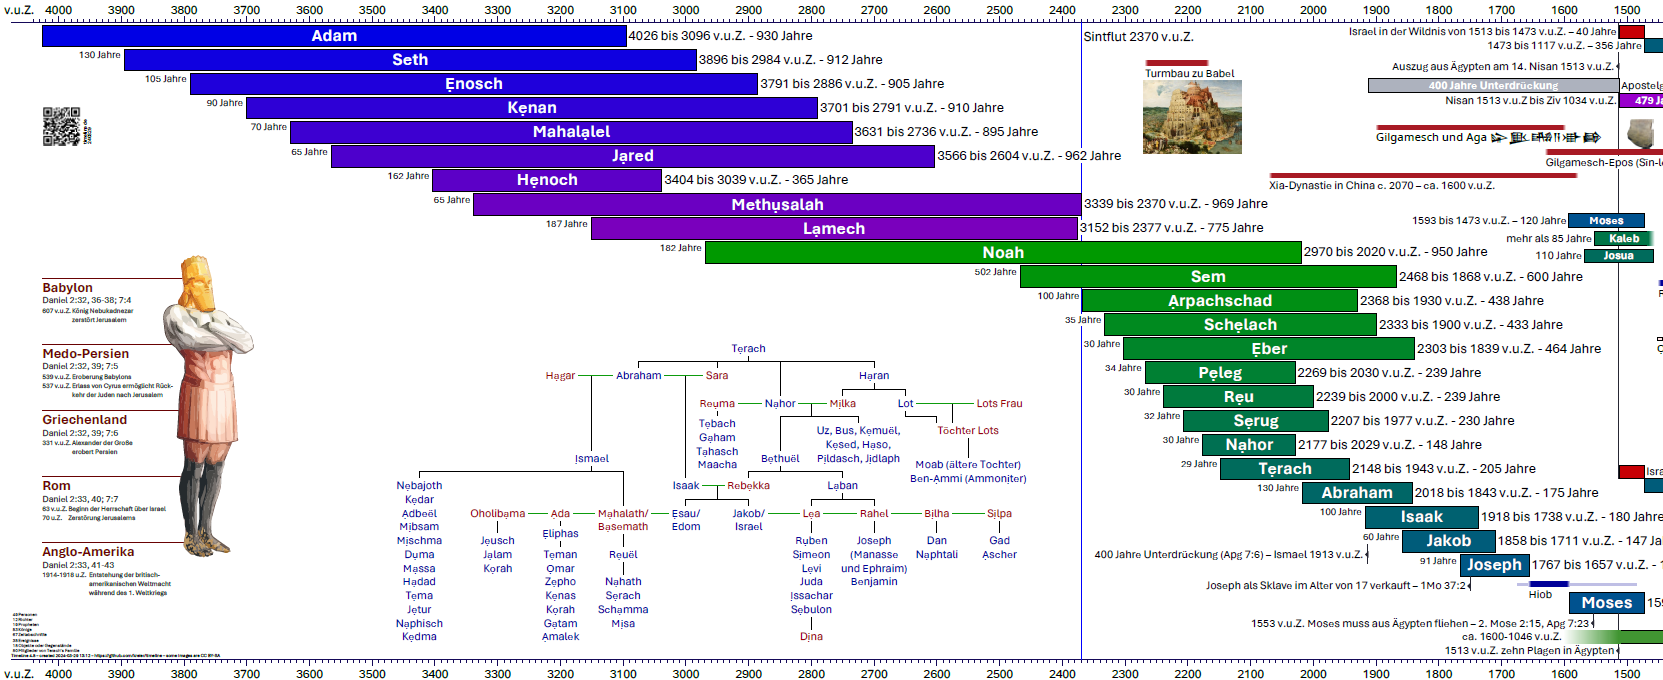
v5.9 Extended family tree back to Noah and relate 20 nations in footnotes
With Noah and his 3 sons in the picture I can relate 20 nations to this family tree instead of just 6 nations. I also add 4 Vietnamese Dynasties, Edo and Meiji period in Japan, Wulfila bible (first designed alphabet with a known creator), a fresh NIRCam image of Pismis 24 by NASA with Webb telescope from September 11th, 2025.
v6.01 Updated numbering system, Kain’s family
In October 2025 I observed problems with the new v5.10 version number, since the float 5.10 < 5.4 in the version number. So features after 5.4 would not be applied for version v5.10 because the float value is smaller. From January 2026 on the version number is therefore no longer v6.1 but instead v6.01 to accomodate for these comparisons inside the 6000.py.
Evolving content
| Version | Date | Persons | Periods | Events | Languages | Keywords | Colors | Images |
|---|---|---|---|---|---|---|---|---|
| 1.0 | February 2009 | 63 | 8 | 20 | 1 | |||
| 1.1 | June 2023 | 63 | 8 | 20 | 2 | |||
| 2.0 | December 2015 | 24 | 2 | 3 | 1 | |||
| 3.0 | October 2023 | 68 | 9 | 0 | 1 | 0 | 8 | |
| 3.5 | November 2023 | 118 | 36 | 40 | 3 | 226 | 109 | |
| 4.0 | January 2024 | 125 | 41 | 40 | 10 | 234 | 112 | |
| 4.2 | February 2024 | 128 | 47 | 52 | 13 | 342 | 119 | 7 |
| 4.3 | March 2024 | 131 | 52 | 52 | 15 | 371 | 128 | 27 |
| 4.4 | April 2024 | 132 | 66 | 53 | 15 | 398 | 142 | 49 |
| 4.6 | June 2024 | 194 | 82 | 45 | 20 | 447 | 162 | 39 |
| 4.9 | November 2024 | 194 | 82 | 45 | 20 | 462 | 162 | 47 |
| 5.3 | March 2025 | 202 | 87 | 48 | 20 | 475 | 166 | 52 |
Inspirations
Some documents gave further insight and inspiration into this project.
Study articles
- Strengthen Your Faith in God’s Word from mwb23.01 for January 16th, 2023
- “The Whole House of Ahab Will Perish”—2Ki 9:8 from mwb22.11 for November 28th, 2022
- Chart: Prophets and Kings of Judah and of Israel (Part 1) from nwtsty in 2013
- Chart: Prophets and Kings of Judah and of Israel (Part 2) from nwtsty in 2013
Historic versions
The idea of a timeline (link to Wikipedia) is neither unique nor new. One example would be Joseph Priestley’s “A New Chart of History” published in 1769 (more than 250 years ago):

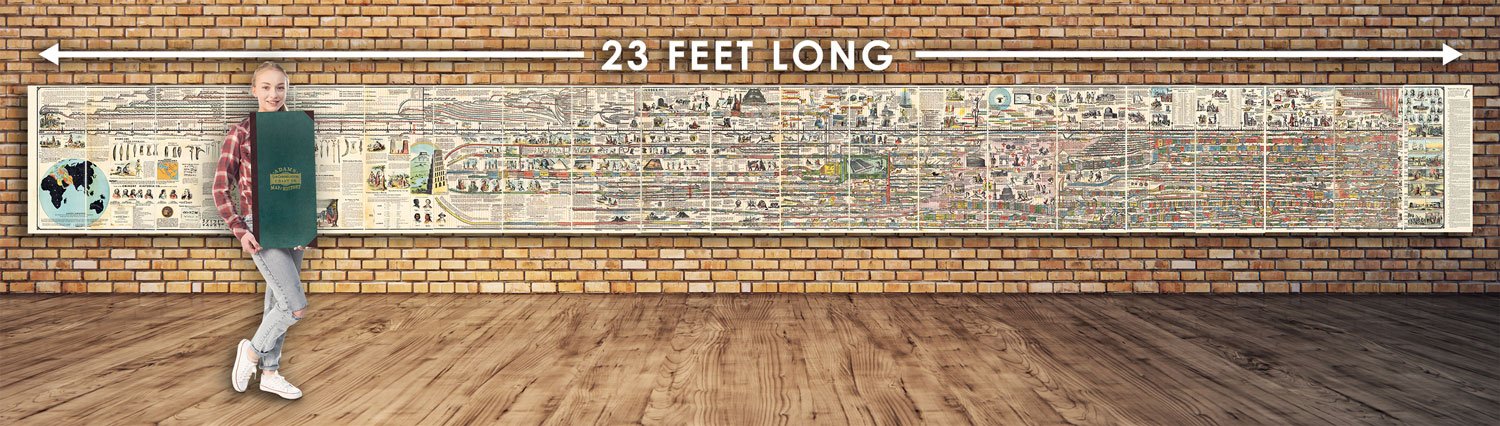
Even more similar to my project is Adams Synchronological Chart or Map of History from 1871 (more than 150 years ago). In wikimedia is a scan of 40445x4309 pixel of this masterpiece. And there you would find a link to the 700 Megapixel JPEG 2000 scan file.

Contemporary versions
In 2008 I got “Knaur’s Zeittafel der Weltgeschichte - Den letzten 6000 Jahren auf der Spur” with a total length of 7 meters. I’m far from having all these information included in my edition. Here are links to two editions at amazon.de.
Here is another example from amazon.de, covering the last 5000 years in 1.2 meter like this project here. The map by Schofield & Sims:

It looks like Knaur’s book is a translated and updated version of Adams Synchronological Chart or Map of History - which is 23’ long (7 meter) and 27” tall (68 cm). The original is from 1871.
The reformation made a timeline for the 220 years 1480 - 1700 AD in a similar style.
Another design attempt to pack a lot of information in a written horizontal way into a timeline that progresses from left to right is this Texan Spiral semicircle project:
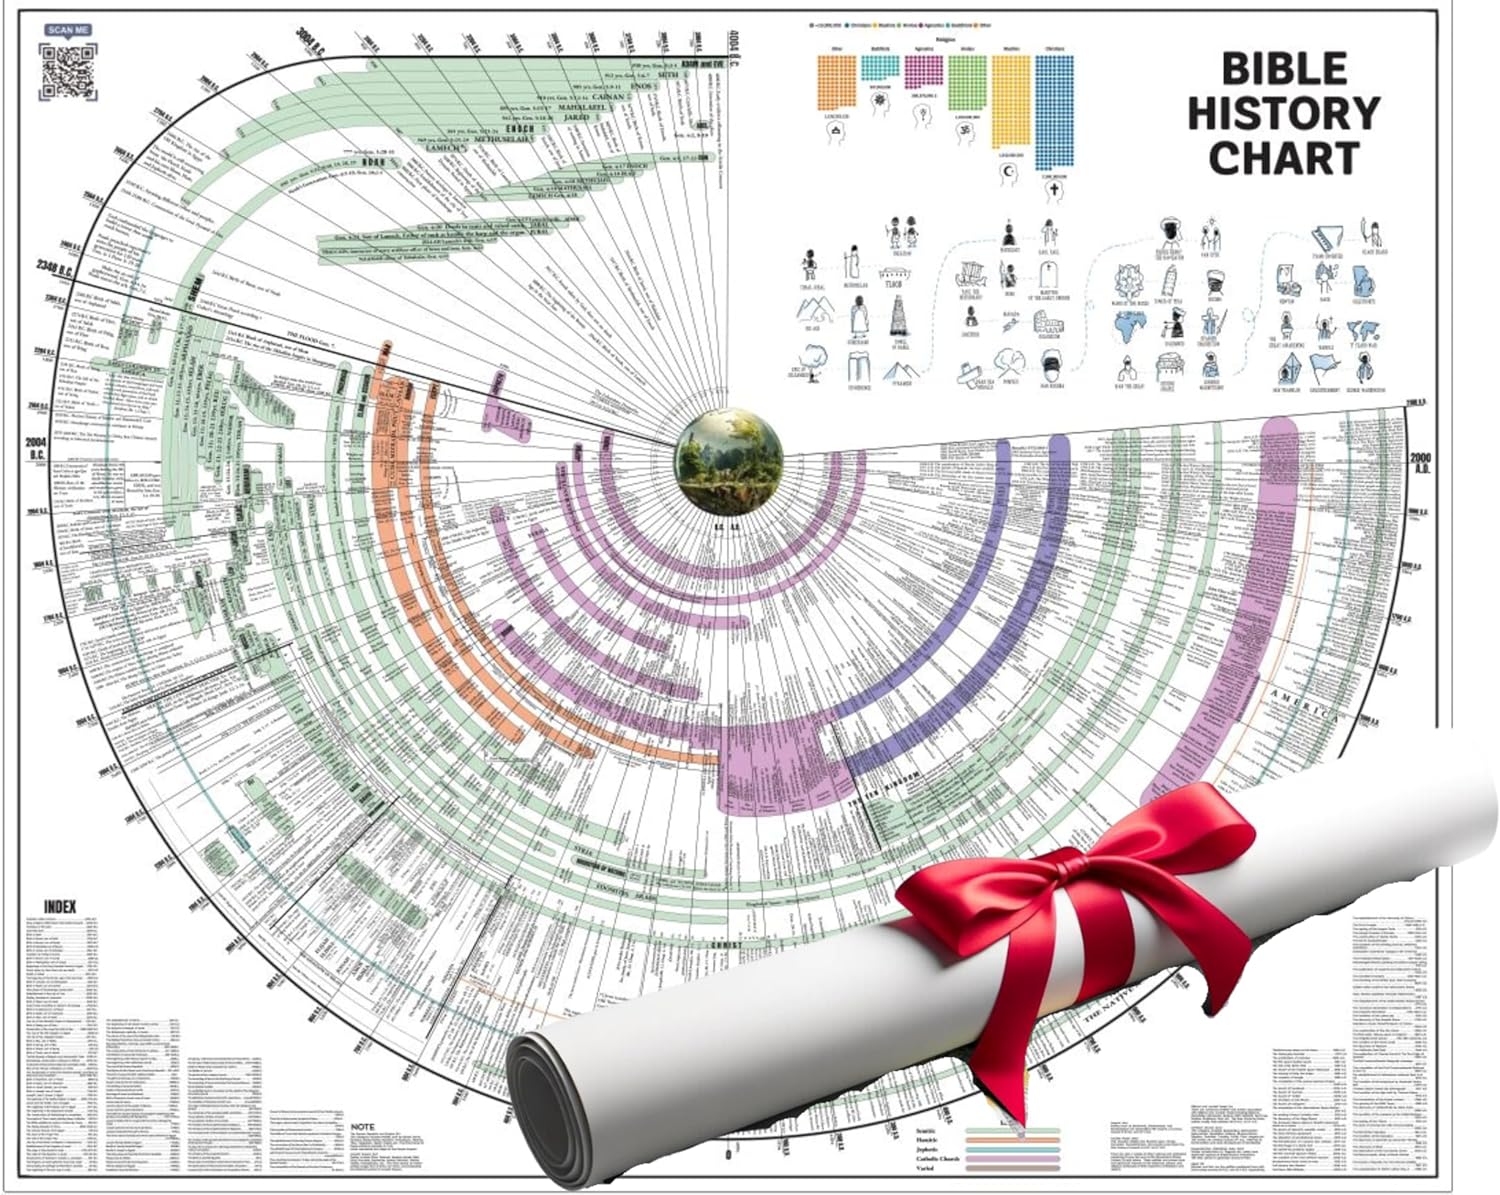
Time of 12 Prophets from 850 BCE to 400 BCE

Other media
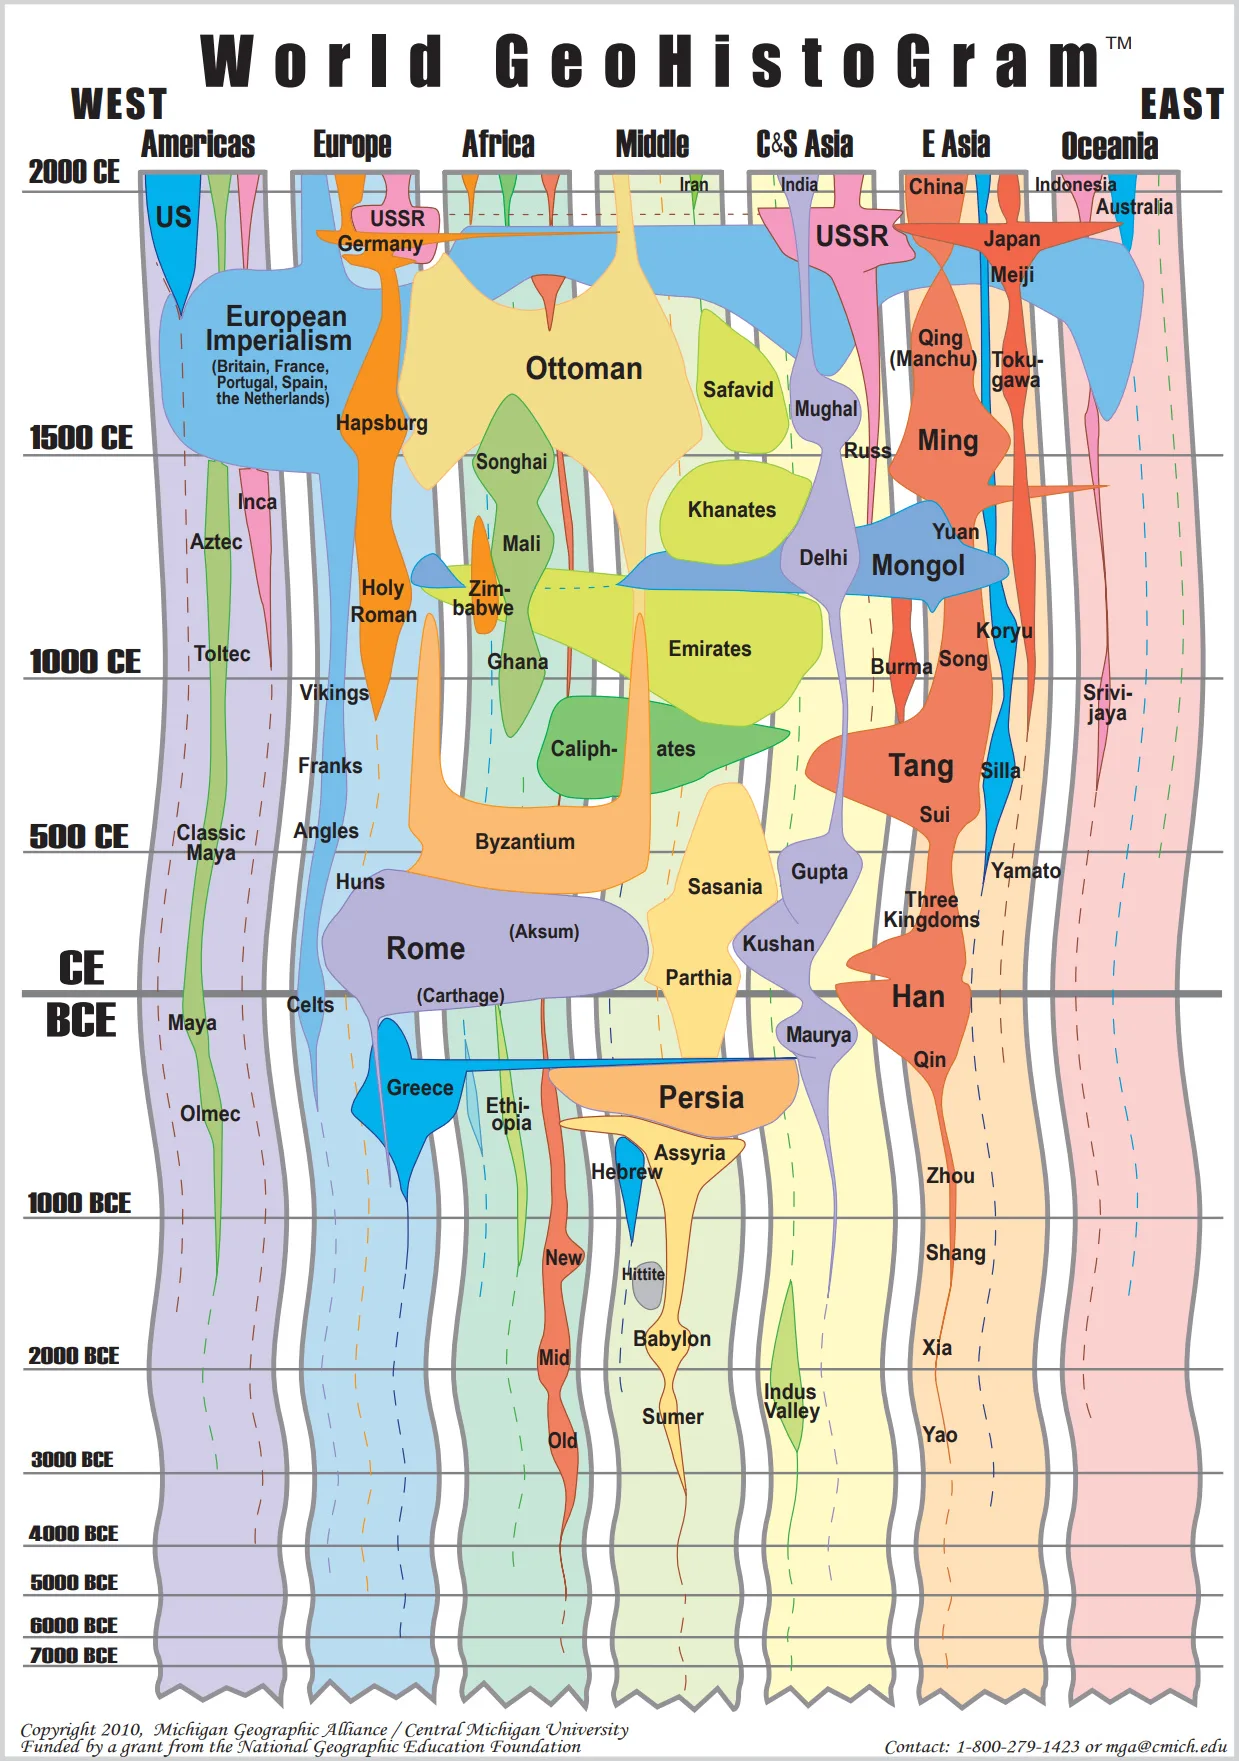
On November 16, 2025, the Visual Capitalist published an article about the The World’s Biggest Empires of History, on One Epic Visual Timeline on their website. Spanning all continents it looks like below:
![]()
Comparison v3.1 October 2023 to v4.4 March 2024
Comparison 2009 vs. 2024
To visualize the progress after 15 years here is a comparison of the spreadsheet version versus a cutout from the python reportlab version for the first 2 time periods of the spreadsheet:
4050 BCE to 1450 BCE
1550 BCE to 150 CE