The repository is named statistics-diary on GitHub. One day I want to have a few statistics to quantify my notes. For example I would like to have the following key parameters:
- Number of written words
- How long would it take to read all of this?
- How many pages?
- How many pictures or images?
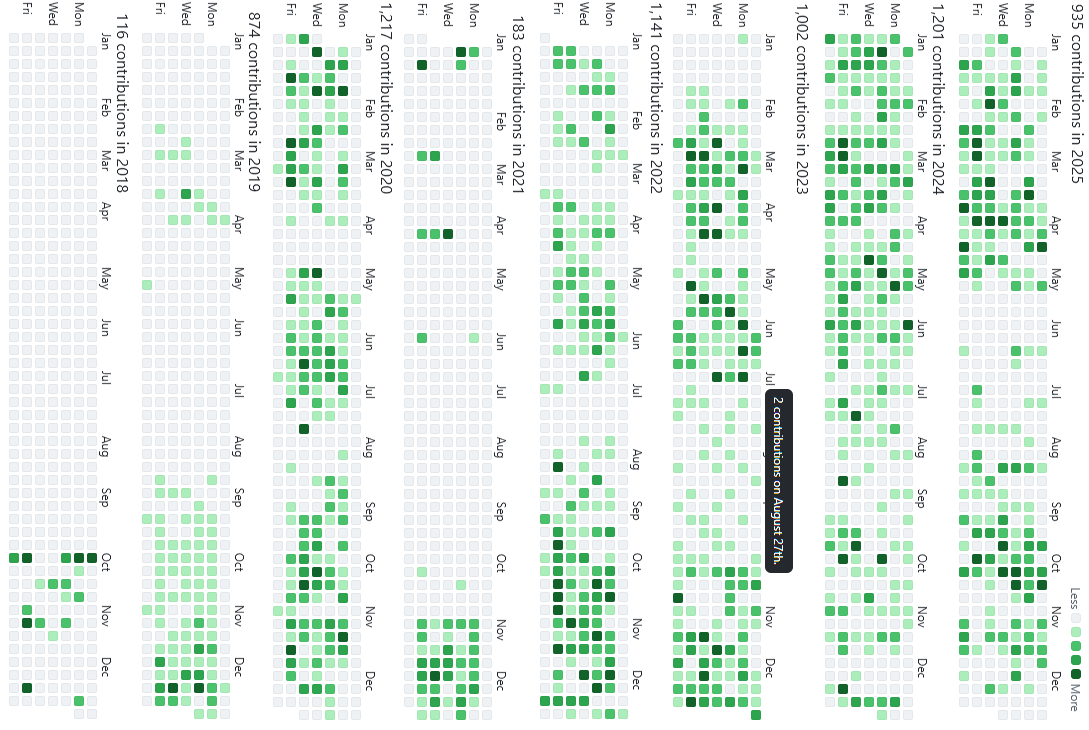
Later I would like to go a little further into detail with this. It would be nice to have an overview of my life as GitHub gives me for my contributions to my repositories, like here for the last 8 years:
I need some structure. Level 1 - Five locations of information and notes:
- Obsidian, at kreier.github.io/quartz and mirrored to diary.saiht.de
- WordPress, at saiht.de/blog
- GitHub Projects, listed at Overview of GitHub Projects
- Manual recent notes of Travel and Projects, from saiht.de/travel and saiht.de/projects
- Legacy content from saiht.de/legacy
In Level 2 we go one level deeper for Obsidian.
Obsidian
There are 5 categories
- Blog with notes about smaller activities over the years
- Diary with a file for each year, and a possible entry for each day. More than 18000 days as of 2025
- Projects described in a structured way, if not specifically part of GitHub (with some overlap)
- Travel will probably copy the saiht.de/travel Website, or it will be the markdown source for the content
- Websites is more of history documentation purpose
Parsing information to create CSV
The five sources should be parsed and the information put into CSV files. The key for each table is the date in the YYYY-MM-DD format. This way I can create the GitHub like overview with tooltips when hovering. I intend to use the following color scheme:
- 🟩 Diary: It will be counted if the day is in bold. Then we might count the words after the date and scale them. Some dates have a subheading above it, so this would appear in chronological order in the TOC on the side. These special dates could appear extra dark, and their tile would reflect that. For the others an exponential slope? GitHub has only 4 levels. With the we have only 3 levels left.
- 🟦 Projects: Just the first submission of a project to GitHub counts. That’s 170 blue dots. And then we use the frontmatter
datefor the CSV file from projects that are documented in Obsidian, and then probably later copied over to saiht.de/projects. - 🟨 Travel: It might be developed in Obsidian, then copied over to saiht.de/travel. Darker for the start and end date (
createdandupdated- see list of frontmatter keywords) and lighter yellow for the time duration of this travel. Link to title name of this vacation - 🟥 Blog: Dates extracted from WordPress, linked to Title of page. 97 red dots by the end of 2025.
For Diary we can link to the subheading or the month the text was written. And count the words in each text entry. For Projects we can parse the MD file about length and create a link to saiht.de/projects/this-is-my-project. Check if this exist! For the GitHub projects, take the repository name as title, take the raw text from the GitHub Pages without images etc to count the words, and link to the website kreier.github.io/project-name since it’s for consumption, not creation. The Travel stories get each its unique title in Obsidian. The journey is form created to updated in frontmatter values. Since the title is a # heading, the days get ”## MM-DD What is this day” entry. Then I can link this day to saiht.de/travel/YYYY/name-of-this-travel
Parsing CSV to create html table
The key for each CSV file is the date in the first column. Maybe created for travel, since we also have updated. The Tables in GitHub appear fixed size, but you can zoom in and scroll them horizontally.
The tables need these categories:
- date
- title
- text
- link
Procedure
First let’s parse or update the parsed CSV files
- update_db_obsidian.py from the local /quartz/content vault
- update_db_obsidian_diary.py for the daily entries.
- First check if all dates (until today) are covered.
- Check if each date is at least terminated with a <> tag that stated “br”
- The table should have: date, text, title (for the big ones), link_internal, link_external
- update_db_obsidian_projects.py
- update projects_github.csv and check against the project_github_topics.csv list that should have all the projects described on GitHub, ordered into one of the categories: school, robotics,
- update_db_obsidian_diary.py for the daily entries.
- update_db_projects.py
- The source it here saiht.de/projects and hopefully updated
History
2025-12-18 Github repository started
The link is https://github.com/kreier/statistics-diary.
2025-12-28 First automated Github-actions bot statistic
I’m happy that now with every successful push to the quartz repository a new Github action starts the update script in the statistics-diary repository. Automation v1.1
2026-02-28 Agentic engineering with Jules from Google
With one big script, written by Gemini 2.5 Pro (and later Gemini 3 Flash) I get a heatmap of my activities on 4 web locations back from 1975. There are some mistakes, but the parsing get’s better. The new repository is https://hviovn.github.io/diary-statistic/